Have you heard of Illwerke VKW? If you're from Vorarlberg, the answer is probably "yes."
The Illwerke VKW Group is a large energy supplier that covers the whole of Vorarlberg (Austria's western province) and the neighboring German province, Westallgäu. Illwerke VKW is listed on the Energy Exchange Austria (EXAA) and the European Power Exchange (EPEX SPOT), which means the energy they produce is traded with other companies on the energy market.
Kopswerk I is one of the larger hydroelectric power plants Illwerke VKW operates. The power plant uses falling water from Kops reservoir to power large industrial Pelton turbines, which in turn generate electricity.
In this post, I will introduce you to proof-of-concept Crate.io has been working on that will help Illwerke VKW improve the operation of Kopswerk I.
An Anatomy of a Hydroelectric Power Station
The Kops reservoir has a storage capacity of 42 million cubic meters of water, which corresponds to an energy content of 127.45 million kilowatt hours.
Here's what it looks like:

Here's the basic overview:
- Water is sent down the penstock (a huge steel pipe) from the reservoir. A surge tank is used to mitigate pressure swings in the penstock, which can occur during the normal operations of the power plant.
- The water propels a turbine, which is connected to a power generator. The water flow onto the turbine is controlled by two separately operated nozzles.
(If you want a more detailed introduction to the operation of a hydroelectric power plant, check out this informative post.)
The four components mentioned above (the reservoir, surge tank, turbine, and generator) are critical to the operation of the power plant. To run the power plant in a safe and efficient way, those components (and individual subcomponents that make them up) must be monitored carefully.
To this end, Gantner Instruments monitoring and control systems have been installed to collect operational measurement.
Here's a cross-section:
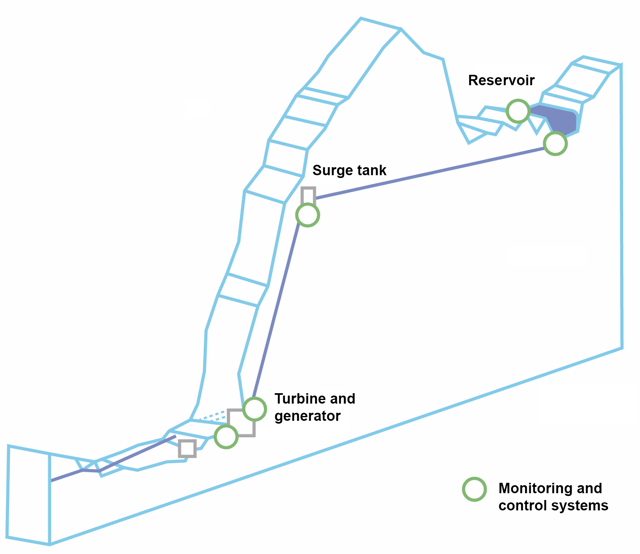
The monitoring and control systems are connected via wired networks across 100 kilometers of terrain and data is fed directly into the Illwerke VKW datacenter.
The following types of measurements are taken along the path the water takes as it travels down the mountain:
- Reservoir and surge tank
- Water level of the reservoir (µAP)
- Water pressure (µAP)
- Turbine
- Limit stop setting of the intake gate (%)
- Break nozzle waterwheel (%)
- Revolutions (%)
- Operational state of the top/bottom water nozzle (%)
- Modulator state of the top/bottom water nozzle (%)
- Volumetric flow rate (m3/s)
- Diverter state (%)
- Diverter water/oil pressure (bar)
- Generator
- Power (W)
- Reactive power (Var)
- Voltage (V)
- Output Frequency (Hz)
Combined, a total of 34 discrete measurements are recorded at a rate of 10 Hz around the clock, every day of the year.
In addition, there is an event-driven system that can record measurements with a dynamic resolution of up to 10 kHz (one thousand times more frequent).
For example, if one standard measurement exceeds a certain threshold, the monitoring equipment can deliver additional measurements at a much higher recording frequency for several minutes.
On average, the Kopswerk I monitoring and control systems collect around 42 million data points every day.
That's equivalent to 5 GB of raw sensor data.
And that data has to be ingested, processed, queried in real-time, visualized, and fed into machine learning algorithms. And the system that handles the data needs to be scalable, highly-available, and provide options for disaster recovery.
And that's where CrateDB comes in.
Meet CrateDB
CrateDB is a new kind of SQL database. Specifically, it is a distributed SQL database.
What does that mean?
Well, historically, SQL databases are scaled by increasing or decreasing the size of the single machine they run on. But that can be a real pain to manage.
In many cases, scaling up a single machine requires capacity planning, amortized hardware costs, lengthy purchasing turnarounds, and physical trips to the data center.
In contrast, CrateDB can be clustered and you can scale a cluster linearly by adding or removing machines. Which make CrateDB uniquely suited to cloud computing providers like Microsoft Azure or containerized computing environments like Docker and Kubernetes.
Query execution can then be parallelized and distributed across the whole cluster, massively improving performance.
In this way, you get the benefit of the horizontaly-scaling shared-nothing architecture typically associated with NoSQL databases, without having to ditch the SQL. Which means you can tap into the huge marketplace of existing third-party SQL tools, applications, and professional skill-sets.
A Proof of Concept
Crate.io partnered with Craftworks (the artificial intelligence specialists) to build a proof-of-concept for Illwerke VKW that uses CrateDB and machine learning to process, analyze, and deliver actionable business intelligence from the massive amounts of data being collected.
In doing so, the Illwerke VKW proof-of-concept exploits CrateDB's blazing fast ingestion throughput and real-time querying capabilities.
What sort of thing are we talking about?
Well, for example, machines at the power plant endure the most mechanical stress during surge chamber oscillation (i.e., when the turbines power up or power down).
To get a proper idea of the wear-and-tear on the machines, you can use the running time and the number of starts and stops to calculate an equivalent continuous running time (i.e., a continuous running time that would result in the same amount of wear-and-tear as the actual intermittent running time.) This is called the Equivalent Operating Hours, and it can be fed into a predictive maintenance system.
Information obtained from calculations like the one mentioned above allows a predictive maintenance system to provide mission-critical real-time insights. It can also support operational decision making, improve efficiency, and ultimately, generate huge cost savings.
We cover predictive maintenance from a data science perspective in our previous miniseries on machine learning with CrateDB. Check it out!
Wrap Up
In this post, I gave you the overview of a proof-of-concept we have been working on with Craftworks to deliver business intelligence for one of Illwerke VKW's key hydroelectric power plants.
Stay tuned for a second post that dives into some of the technical details of the Illwerke VKW proof-of-concept.
In the meantime, check out our machine learning miniseries if you want to learn more about CrateDB, machine learning, and data science.
Got questions? Get in touch!