Feedback
Monitoring and Metrics with CrateDB
Storing metrics data for the long term is a common need in systems monitoring scenarios. CrateDB offers corresponding integration adapters.
Learn how to use CrateDB together with popular metrics collection agents, brokers, and stores.
Prometheus
Prometheus is an open-source systems monitoring and alerting toolkit for collecting metrics data from applications and infrastructures.
Prometheus collects and stores its metrics as time series data, i.e. metrics information is stored with the timestamp at which it was recorded, alongside optional key-value pairs called labels.
Features
Prometheus’s main features are:
a multi-dimensional data model with time series data identified by metric name and key/value pairs
PromQL, a flexible query language to leverage this dimensionality
no reliance on distributed storage; single server nodes are autonomous
time series collection happens via a pull model over HTTP
pushing time series is supported via an intermediary gateway
targets are discovered via service discovery or static configuration
multiple modes of graphing and dashboarding support
Remote Endpoints and Storage
The Prometheus remote endpoints and storage subsystem, based on its remote write and remote read features, allows to transparently send and receive metric samples. It is primarily intended for long term storage.
This is where CrateDB comes into place. Using the CrateDB Prometheus Adapter, one can easily store the collected metrics data in CrateDB and take advantage of its high ingestion and query speed and friendly UI to massively scale-out Prometheus.
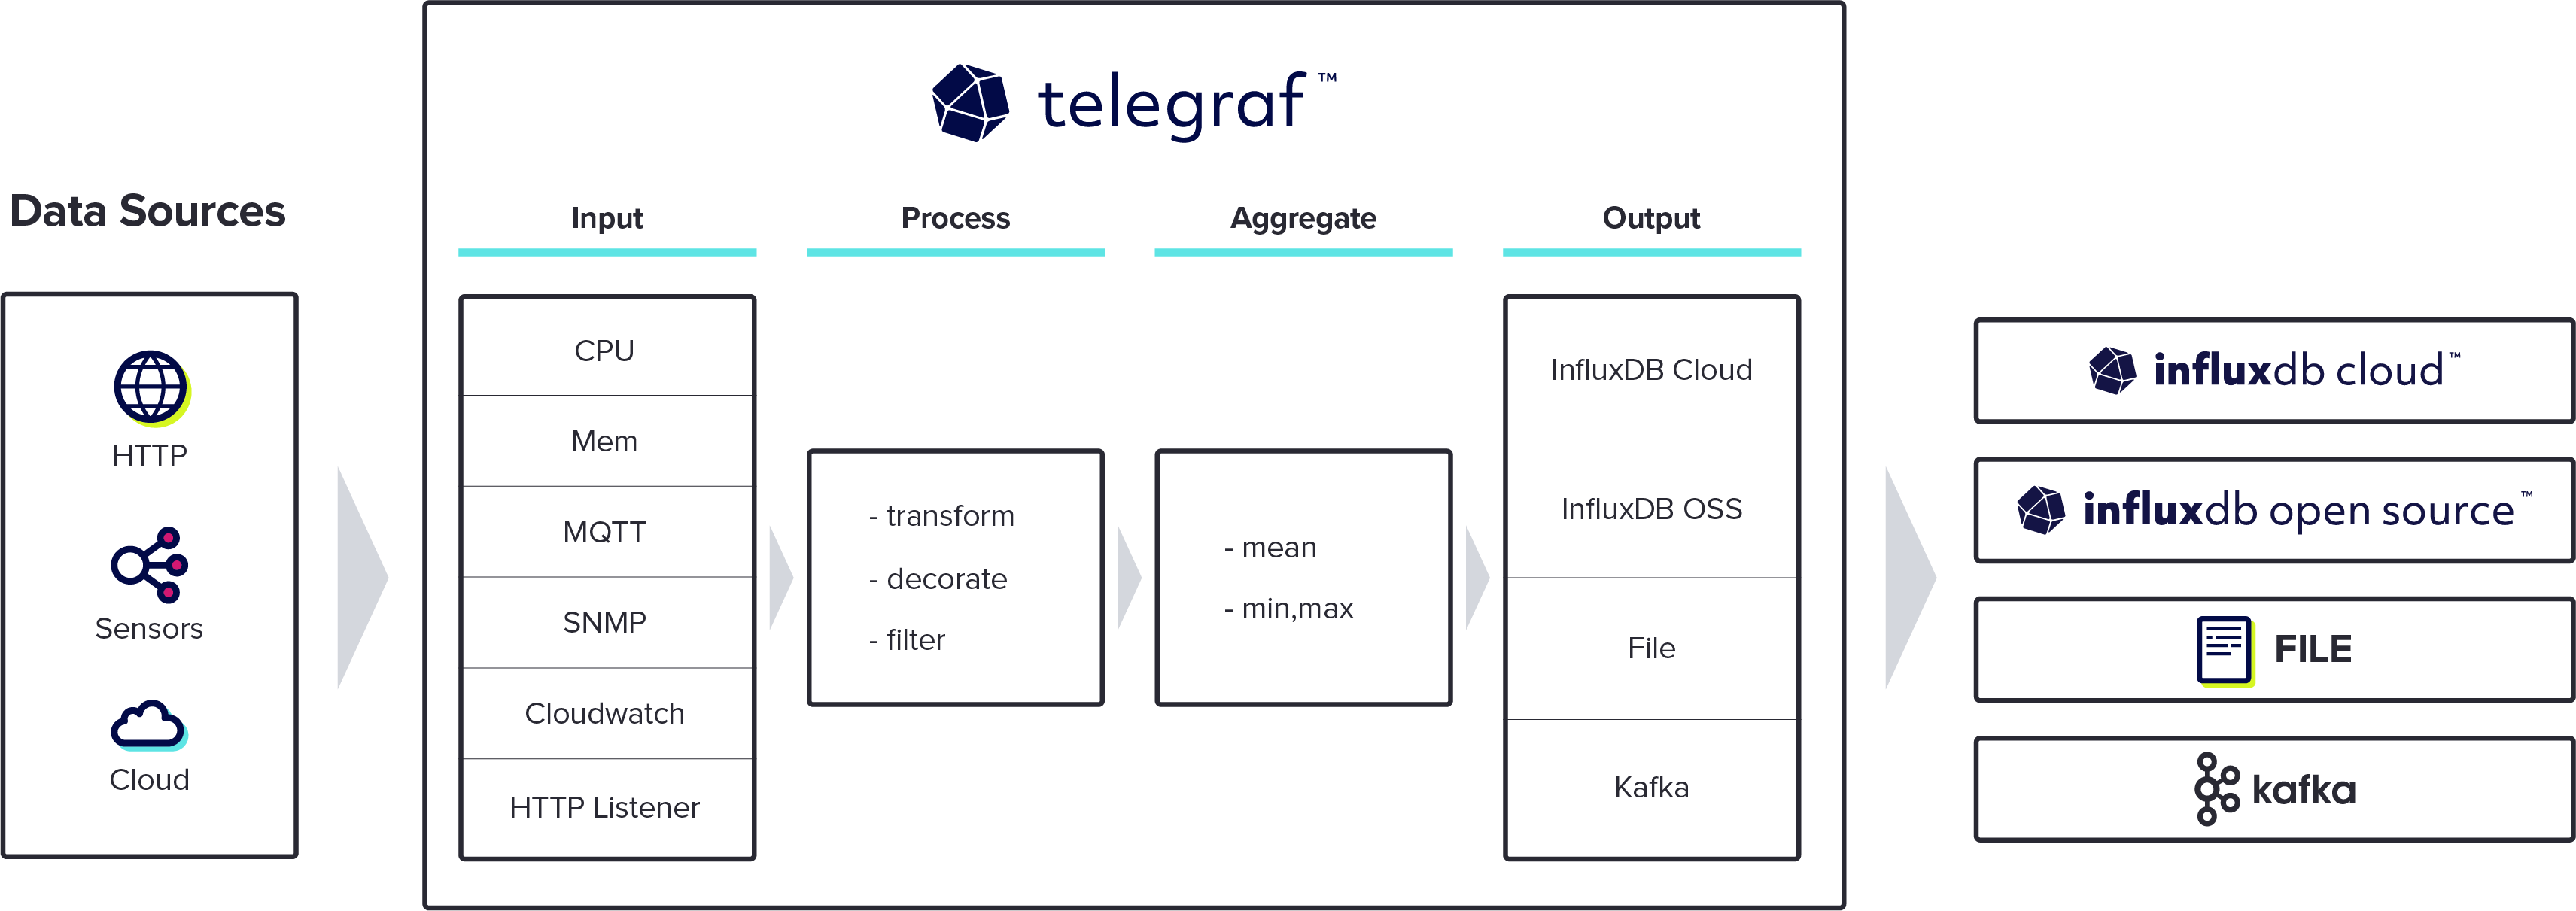
Telegraf
Telegraf is a leading open source server agent to help you collect metrics from your stacks, sensors, and systems. More than 200 adapters to connect to other systems leaves nothing to be desired.
Telegraf is a server-based agent for collecting and sending all metrics and events from databases, systems, and IoT sensors. Telegraf is written in Go and compiles into a single binary with no external dependencies, and requires a very minimal memory footprint.
Overview
IoT sensors: Collect critical stateful data (pressure levels, temperature levels, etc.) with popular protocols like MQTT, ModBus, OPC-UA, and Kafka.
DevOps Tools and frameworks: Gather metrics from cloud platforms, containers, and orchestrators like GitHub, Kubernetes, CloudWatch, Prometheus, and more.
System telemetry: Metrics from system telemetry like iptables, Netstat, NGINX, and HAProxy help provide a full stack view of your apps.
See also