SQLPad is a self-hosted web app for writing and running SQL queries and visualizing the results. Its goal is to be a simple tool for exploratory data work and visualizations, ideal for data analysts who would prefer to work in SQL.
SQLPad has native support for CrateDB, and is designed to be run on an internal network for a single team. All connections and all queries can be accessed, run, and edited by anyone with access to the app.
In this post I will show you how to get set up with CrateDB and SQLPad on macOS, but these instructions should be trivially adaptable for Linux or Windows.
Install CrateDB
If you don't already have CrateDB running locally, it's very easy to get set up.
Run this command:
This command downloads CrateDB and runs it from the tarball. If you'd like to install CrateDB more permanently, or you are using Windows, check out our collection of super easy one-step install guides.
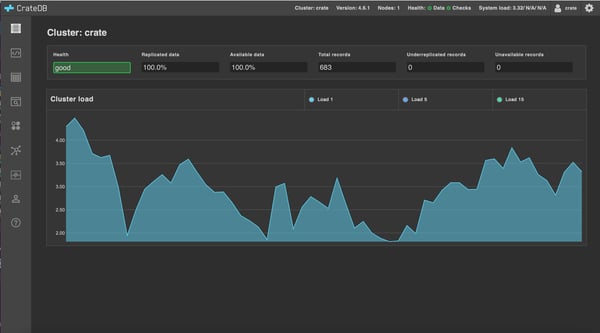
If you're using the command above, it should pop open the CrateDB admin UI for you automatically once it has finished. Otherwise, head over to http://localhost:4200/#/help in your browser.
You should see something like this:

Get Some Data
If you’re playing around with a fresh CrateDB install, chances are you don't have any data. So let's import some tweets.
But wait!
Before you click on anything, we need to make some preparations.
The tweet import feature creates a tweets table for us with a bunch of fulltext indexes.
But for the purposes of this demonstration, we want to slice and dice the text using aggregate functions. So fulltext indexes are not what we want.
Instead, head on over to the console by selecting the console icon from the left-hand navigation menu.
You should see something like this:

Copy and past the following SQL into this text box:
Then select EXECUTE QUERY.
Don't worry. If you've already created a tweets table, you can drop it with this:
Once you're done, you should have a brand new tweets table.
You can verify this by heading on over to the tables browser by selecting the tables icon from the left-hand navigation menu.
You should see something like this:

Perfect!
We're ready to start importing some tweets.
Head back over to the help screen by selecting the help icon from the left-hand navigation menu.
Now, select IMPORT TWEETS FOR TESTING and follow the instructions to authenticate your Twitter account.
Don't worry. This isn’t going to post anything on your behalf. It doesn’t even look at your tweets. All this does is import a bunch of recent public tweets.
If the tweet import counter seems to pause after a thousand or so, stop and then start the import again. You've probably just run into a Twitter per-request limit.
Do this as many times as you have patience for. Over ten thousand tweets total is probably a good number to aim for. We want as many as possible so that our visualizations will be interesting.
After you're done, head back over to the tables browser.
You should see that the tweets table is full of records:

We can move on.
Get SQLPad Running
The SQLPad provides full installation and administration documentation.
But for the purposes of this post, I will show you how to quickly get up-and-running with a local SQLPad install.
First of all, you will need Node.js installed. On macOS, you can do this with Homebrew, like so:
Once that's done, install SQLPad, like so:
Then you can start SQLPad, like so:
Port 8080 is an arbitrary choice. You can choose whatever port you like, or omit this option entirely if you're happy with SQLPad choosing a port number at random.
If you visit http://localhost:8080/, you should see a page like this:

From here, select Sign Up, and follow the instructions. This information is stored locally by SQLPad.
After signing up, you can sign in.
Connect to CrateDB
Once you're signed in, you should see a screen like this:

From here, select your username from the right-hand side of the top navigation menu, and then select Configurations.
You should see a screen like this:

Select New Connection.
A modal dialogue should pop up. Start filling it out, and after you select the Crate driver, some more options will appear.
You should fill the whole thing out like this:

Select Test if you want to test that everything is working.
If you get an error, make sure that CrateDB is running and that you have the hostname and port number correct.
When you're done, select Save.
You should see something like this:

Run Your First Query
Select New Query from the top navigation menu.
On the screen that comes up, you should see a query window, and a list of tables on the left-hand side. If you click into the tables, you will be shown the table schema. It should look something like this:

At this point, feel free to play with the data and see what's available. A simple SELECT * FROM tweets will get you going.
Use the Format button to format the query nicely, and use the Run button to actually execute the query. You can also drag the results window up to make more room for it if you like.
Here's an example:

Dig Into the Data
Let's dig into the data and see if we can find anything interesting.
You will notice that each record has a source column. This corresponds to the app that was used to post the tweet.
So how about we slice and dice this to get a distinct list of client apps and a count of how many tweets each one was responsible for. This will give us an idea about the relative popularity of each client.
Here's a query that gets us what we want:
In case you were wondering, the '>([^<]+)<' regular expression is a simplistic (but good enough for this demo) way to grab the client name from the HTML in the client column, which looks like this:
When you Run this query, you should see results like this:

Notice the black lines under the count values? They function like pseudo bar charts.
But do you know what's better than pseudo bar chats?
Real bar charts.
Graphs, Graphs, Graphs!
With the previous query results still active, select the Vis button from the top sub-navigation menu.
Then, from the drop-down menu in the top left-hand corner, select Bar - Vertical, and some more options should present themselves.
From here, configure the following:
- Bar Label:
client - Bar Value:
count
Give it a second or two, and a graph should appear, like this:

It turns out that Twitter clients have a long-tail distribution.
Which isn't surprising if you're familiar with the long-tail and it's relationship to almost anything to do with the internet.
We've set a LIMIT 20 here. If you want to see how long the long tale is, remove this clause.
Here's a zoomed out version of the exported graph I got when I tried this myself:

Pretty long... 🤣
Wrap Up
SQLPad is a great tool for querying CrateDB and playing around with and visualizing the data. I'm sure there's many more ways you can dig into the test data that you already have.
Some ideas to get you started:
- What's the relationship between tweet counts and follower counts?
- What's the relationship between following count and follower count?
- What does the distribution of tweet lengths look like?
The CrateDB reference has more information on writing queries. And don't forget: you can install SQLPad on your network and share queries and visualizations with the rest of your team. Check out the documentation for more information.