Telegraf is a plugin-based agent that is responsible for collecting, processing, and sending the metrics of a machine that you want to monitor to your CrateDB database.
With Telegraf, one can source metrics directly from the system it’s running on, pull metrics from third-party APIs, and collect sensor data from Internet of Things (IoT) devices. These tasks are made easier by over 200 available plugins, and the ease of plugin development means you can create your own plugin to suit your monitoring needs.
Finally, you can write your data to a variety of other data stores, services, and message queues, including CrateDB.
In this post, I am going to show you how to
- set up Telegraf
- have Telegraf send metrics data to CrateDB
- visualize the collected data with Grafana
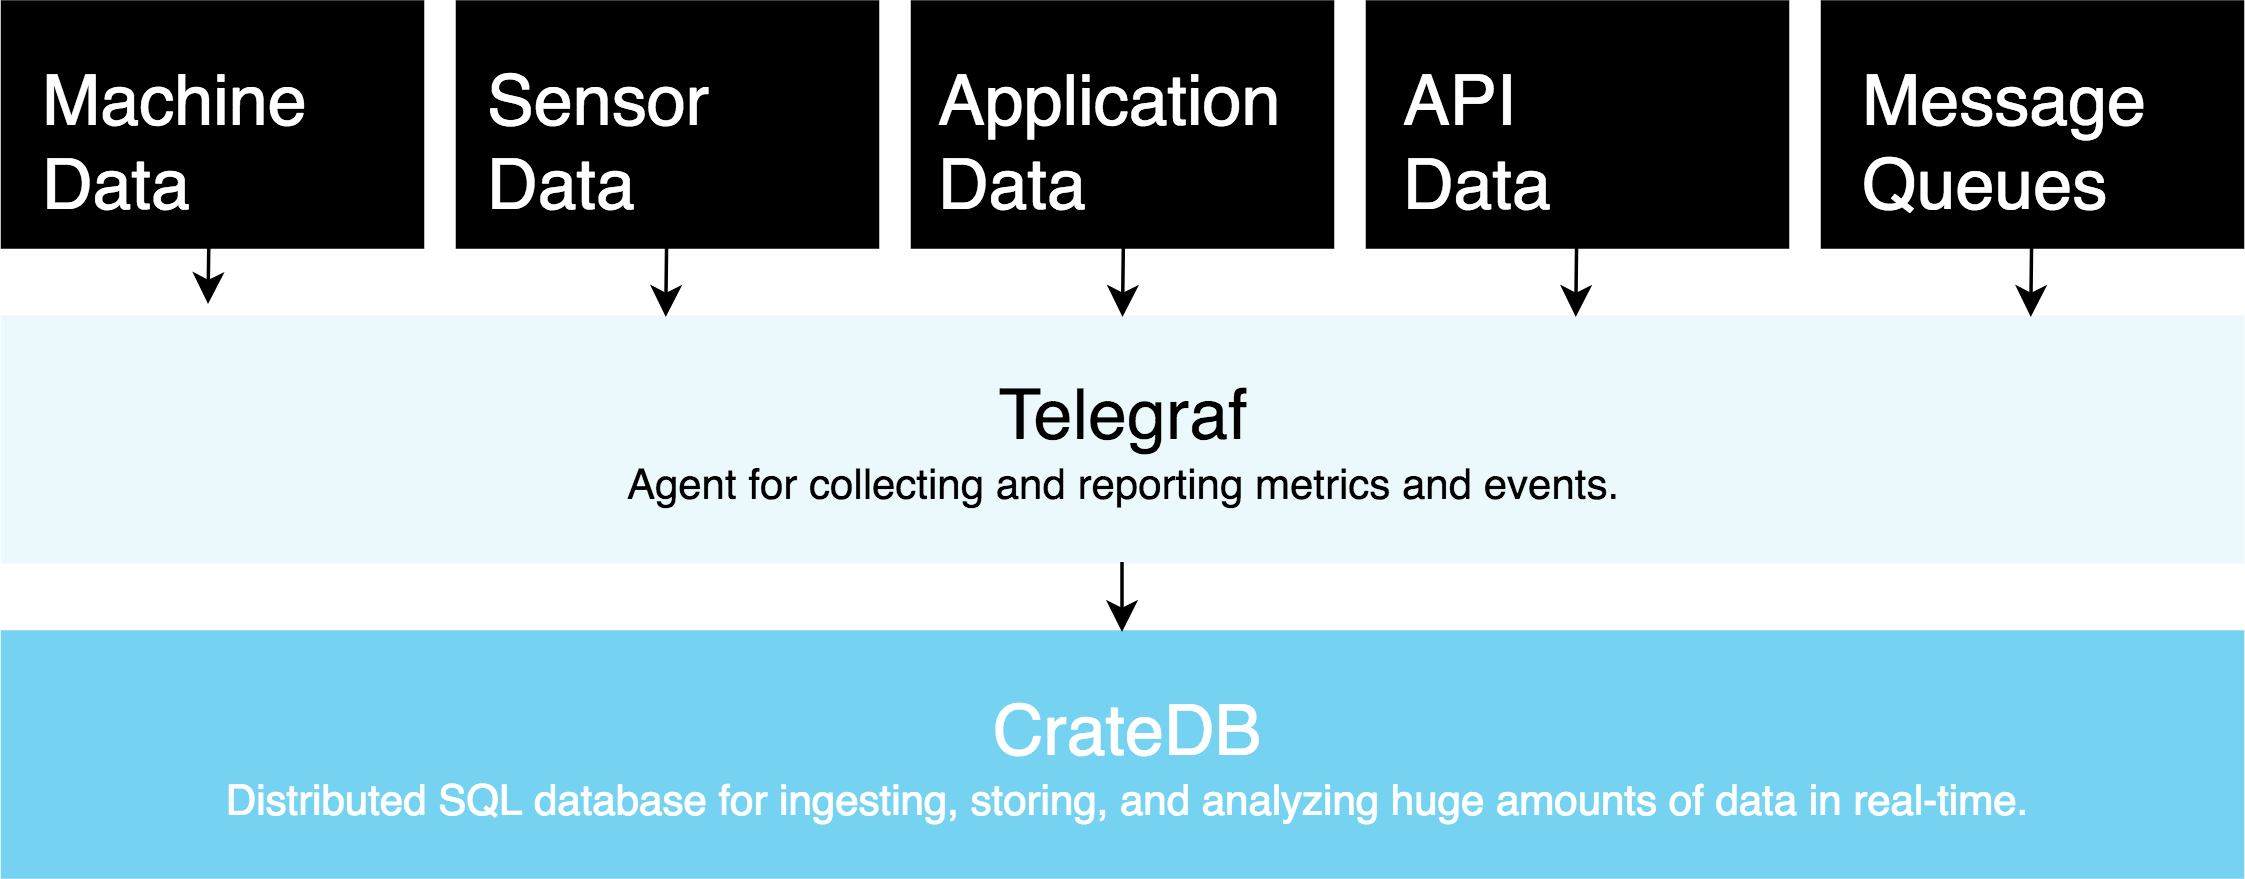
With this setup, you can collect metrics with Telegraf and then take advantage of CrateDB's capacity for ingesting, storing, and analyzing huge amounts of data in real-time.
I will show you how to do this on macOS, but these instructions should be adaptable for Linux or Windows systems.
Installing CrateDB
In this tutorial, I use the ad-hoc method to install CrateDB, following this step-by-step tutorial. First, I download CrateDB (version 4.6.1) and unpack it. In the terminal, I navigate to the unpacked CrateDB root folder with the command
cd /crate-4.6.1
and run a single-node instance from CrateDB with
./bin/crate
Other installing options (e.g. Docker) are described in CrateDB Installation Tutorial.
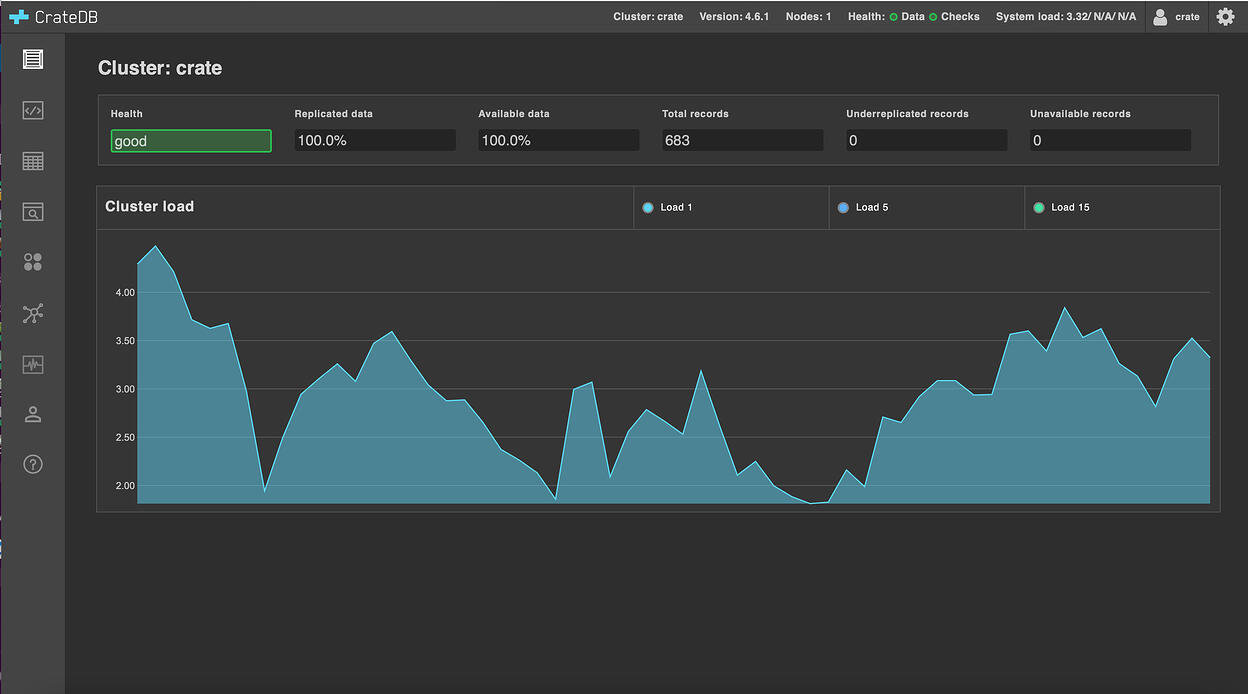
Open http://localhost:4200 in your browser to connect to the CrateDB Admin UI:
Installing Telegraf
If you're using macOS, you can install Telegraf from the Terminal with Homebrew:
$ brew update
$ brew install telegraf
If you are using a different operating system or are looking for more details regarding the installation, head over to the Telegraf Installation Documentation.
After running the commands above, I am presented with the option to start Telegraf as a system service or use the system-wide configuration file:
==> Pouring telegraf--1.20.0.big_sur.bottle.tar.gz
==> Caveats
To start telegraf:
brew services start telegraf
Or, if you don't want/need a background service you can just run:
/usr/local/opt/telegraf/bin/telegraf -config /usr/local/etc/telegraf.conf -config-directory /usr/local/etc/telegraf.d
For the purposes of this demo, however, I will show you how to set things up in a temporary fashion in the following section.
Setting up Telegraf
The first thing I do is generate the default configuration file, like so:
$ telegraf \
    --input-filter cpu \
    --output-filter cratedb \
    config > telegraf.conf
- Telegraf is a plugin-driven tool and has plugins to collect many different types of metrics. I just want to test things out, so I'm using
--input-filter cputo limit input plugins so that Telegraf only collects readings about CPU usage on my local computer - I want to send the collected data to CrateDB, so I can use
--output-filter cratedbto limit the output plugins - Finally, I get
telegraphto generate a configuration file and redirect that output to a file named telegraf.conftelegraf.conf.
If you wish to learn more about this configuration and how to easily adapt it, head to the Telegraf configuration documentation.
Now, I can open the telegraf.conf file in my favorite text editor. For this tutorial, I will use DataGrip: you can find a more detailed CrateDB with DataGrip tutorial on our blog, but for this use, a simple installation should be enough.
On DataGrip, I scroll down the telegraf.conf file, where I find the INPUT PLUGINS section.
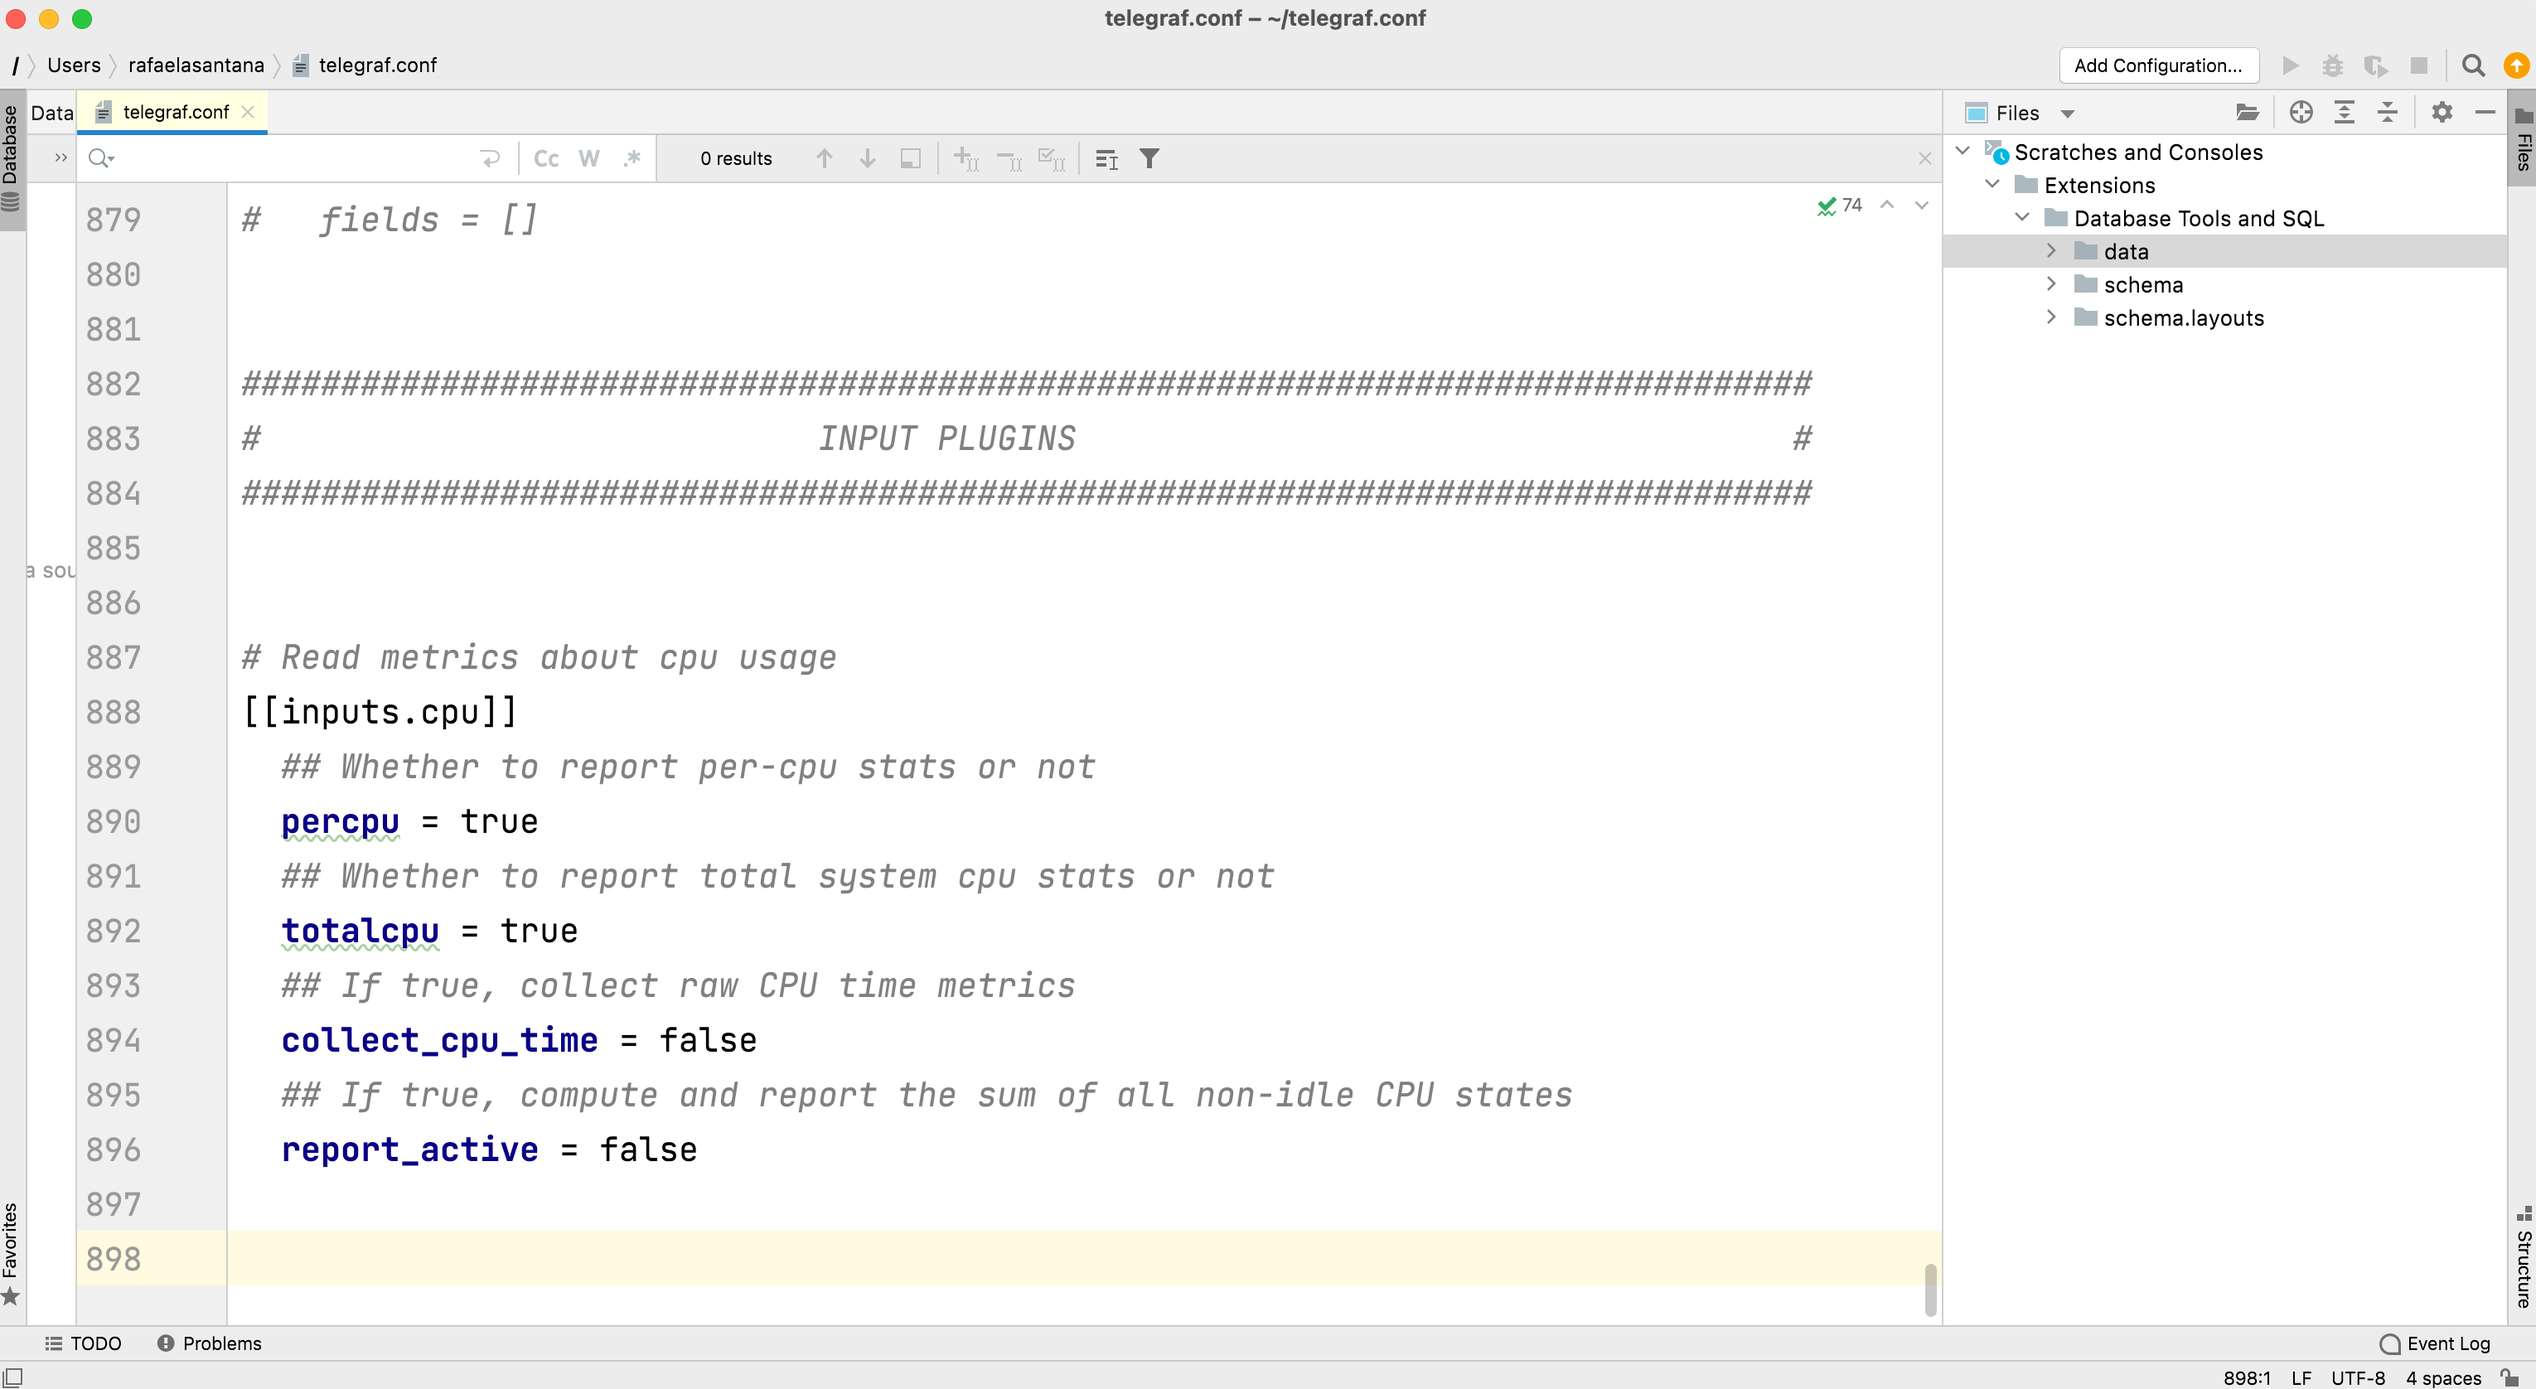
This part of the file is showing the input configuration I did previously. For the purpose of this tutorial, there is no need to alter this section.
Now I scroll up to the OUTPUT PLUGINS section, which looks like this:
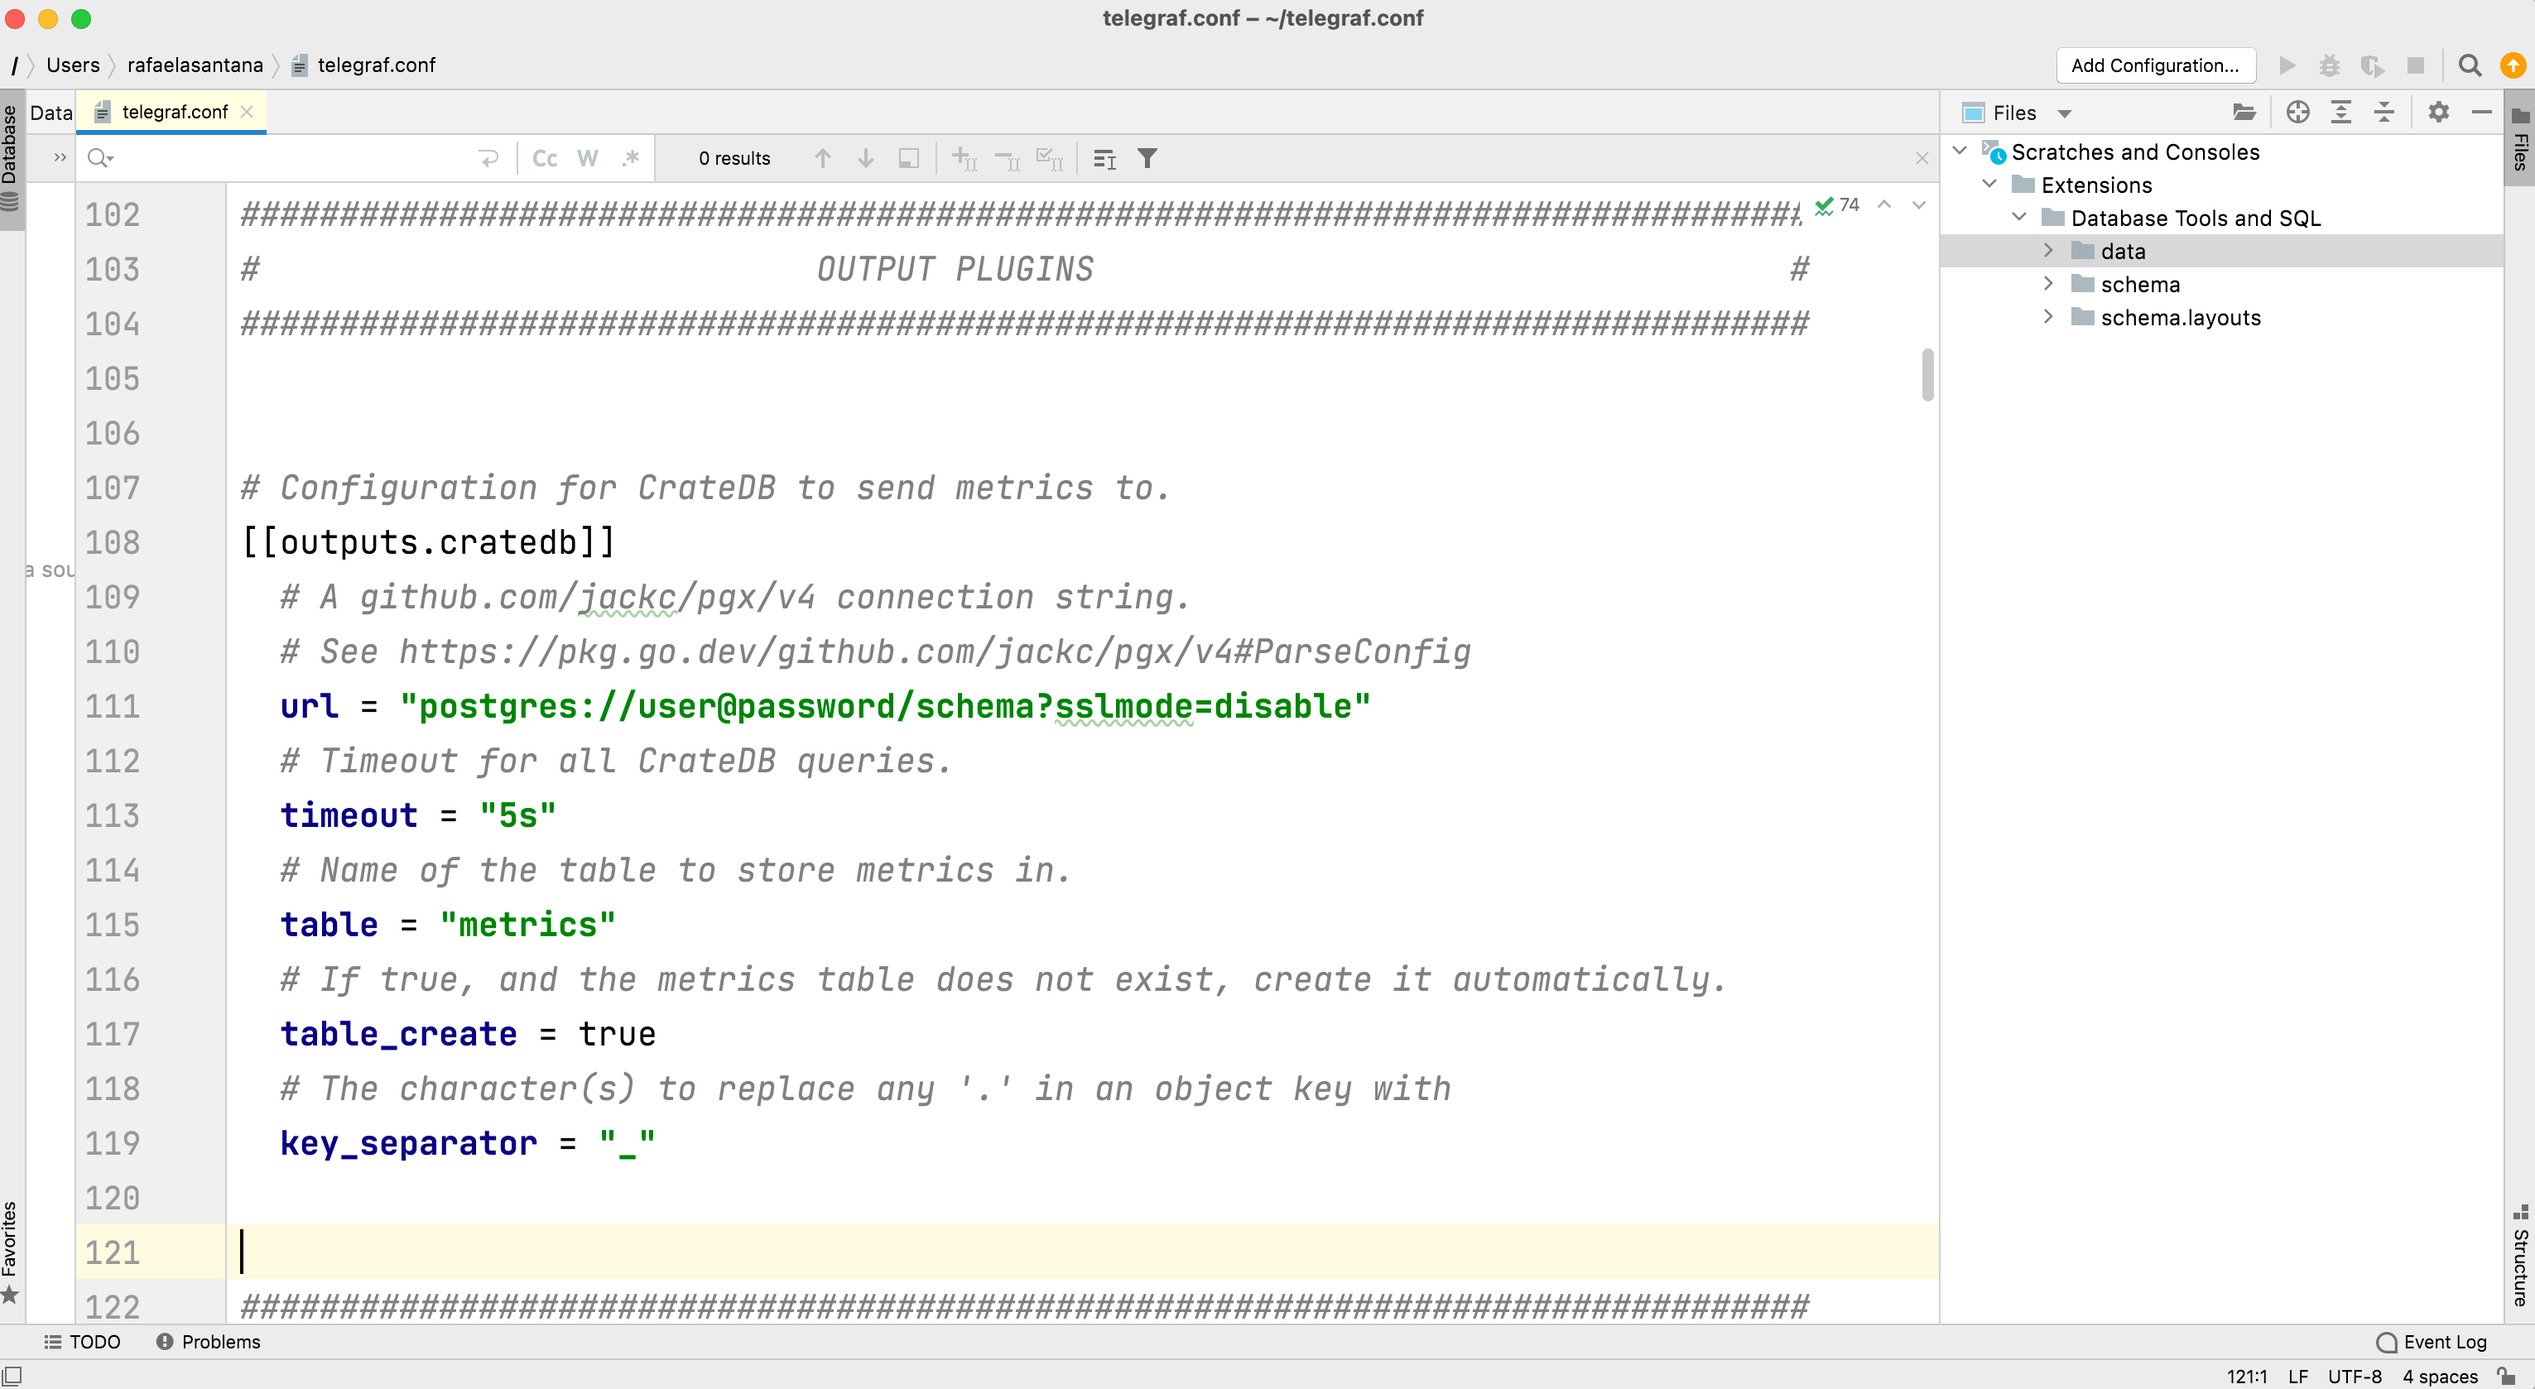
This is the part of the configuration where I set up the connection to CrateDB. If you look at the url variable, you'll notice that we are using the PostgreSQL connection protocol and that the user, password, and schema have not yet been set up. So I will edit the url to connect to CrateDB with the default crate user (that doesn’t require a password) and the doc schema. In the end, the whole section will look like this:
# Configuration for CrateDB to send metrics to.
[[outputs.cratedb]]
  # A github.com/jackc/pgx/v4 connection string.
  # See https://pkg.go.dev/github.com/jackc/pgx/v4#ParseConfig
  url = "postgres://crate@localhost/doc?sslmode=disable"
  # Timeout for all CrateDB queries.
  timeout = "5s"
  # Name of the table to store metrics in.
  table = "metrics"
  # If true, and the metrics table does not exist, create it automatically.
  table_create = true
  # The character(s) to replace any '.' in an object key with
  key_separator = "_"
Notice also that I’ve left table_create = true, and this means that when I start up Telegraf, it will create the necessary table in CrateDB for me.
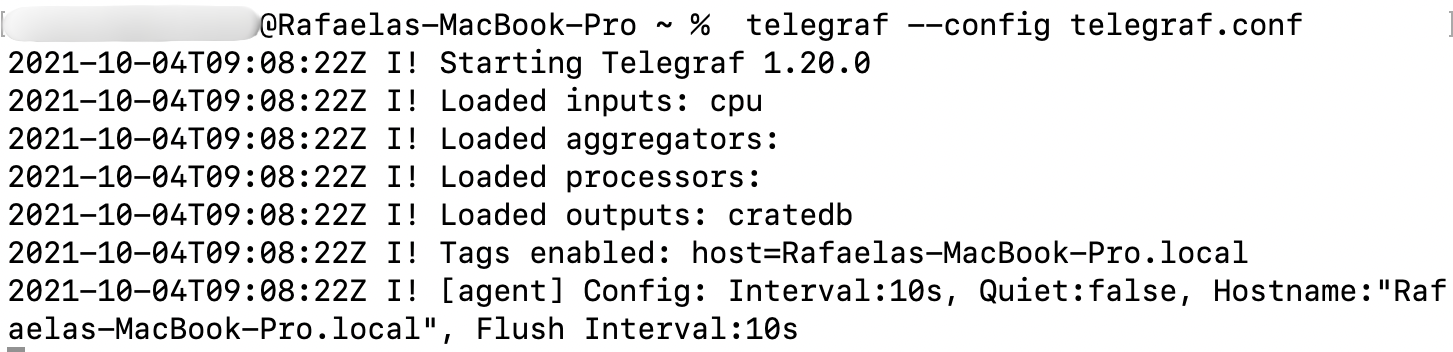
Running Telegraf
Running Telegraf is fairly simple with the terminal command
$ telegraf --config telegraf.conf
and a few stats will show on my terminal
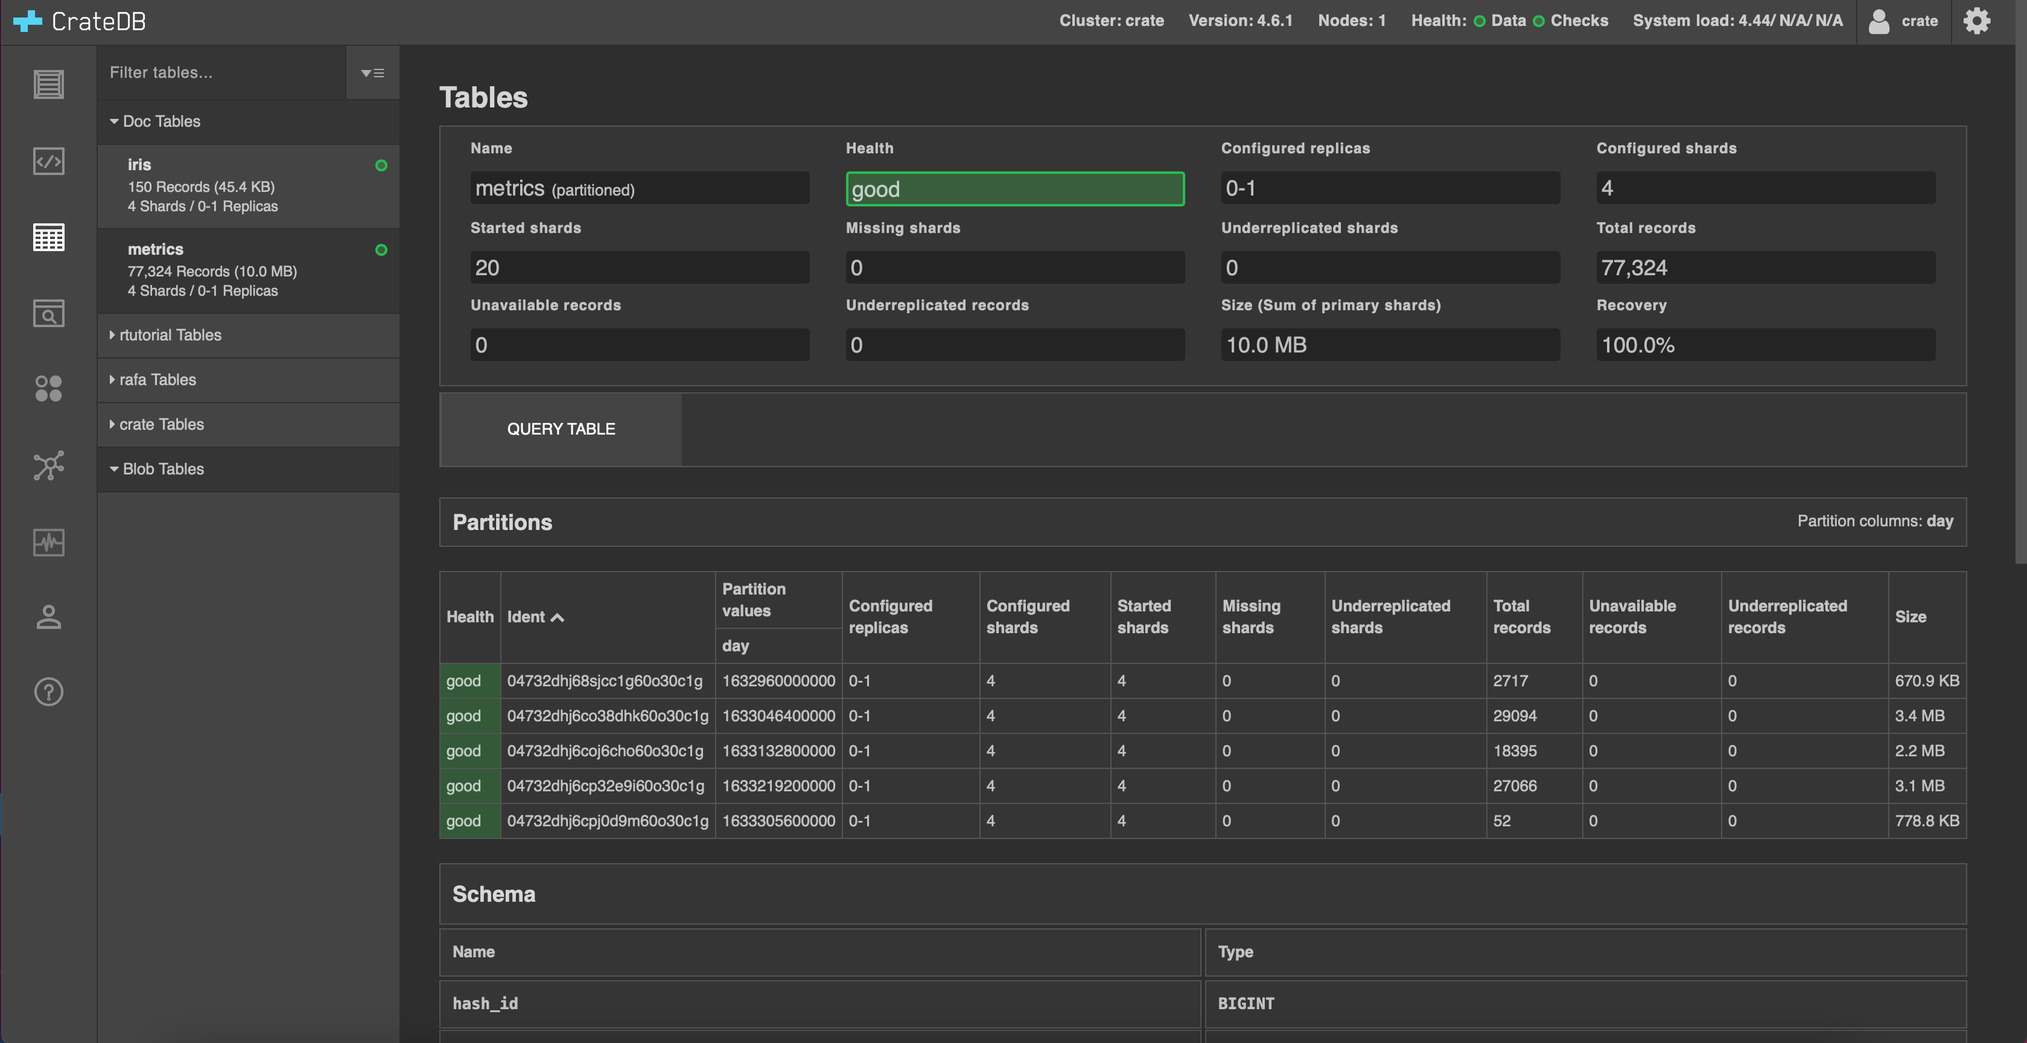
Visualizing the collected data in the Admin UI
By running Telegraf on the previous step, a new table called metrics was created on CrateDB. I can easily see this table by opening the CrateDB Admin UI on the localhost at http://localhost:4200/ and then heading to the doc schema ➞ metrics table
By clicking on QUERY TABLE and then SUBMIT QUERY, the table's rows will be displayed on the console:
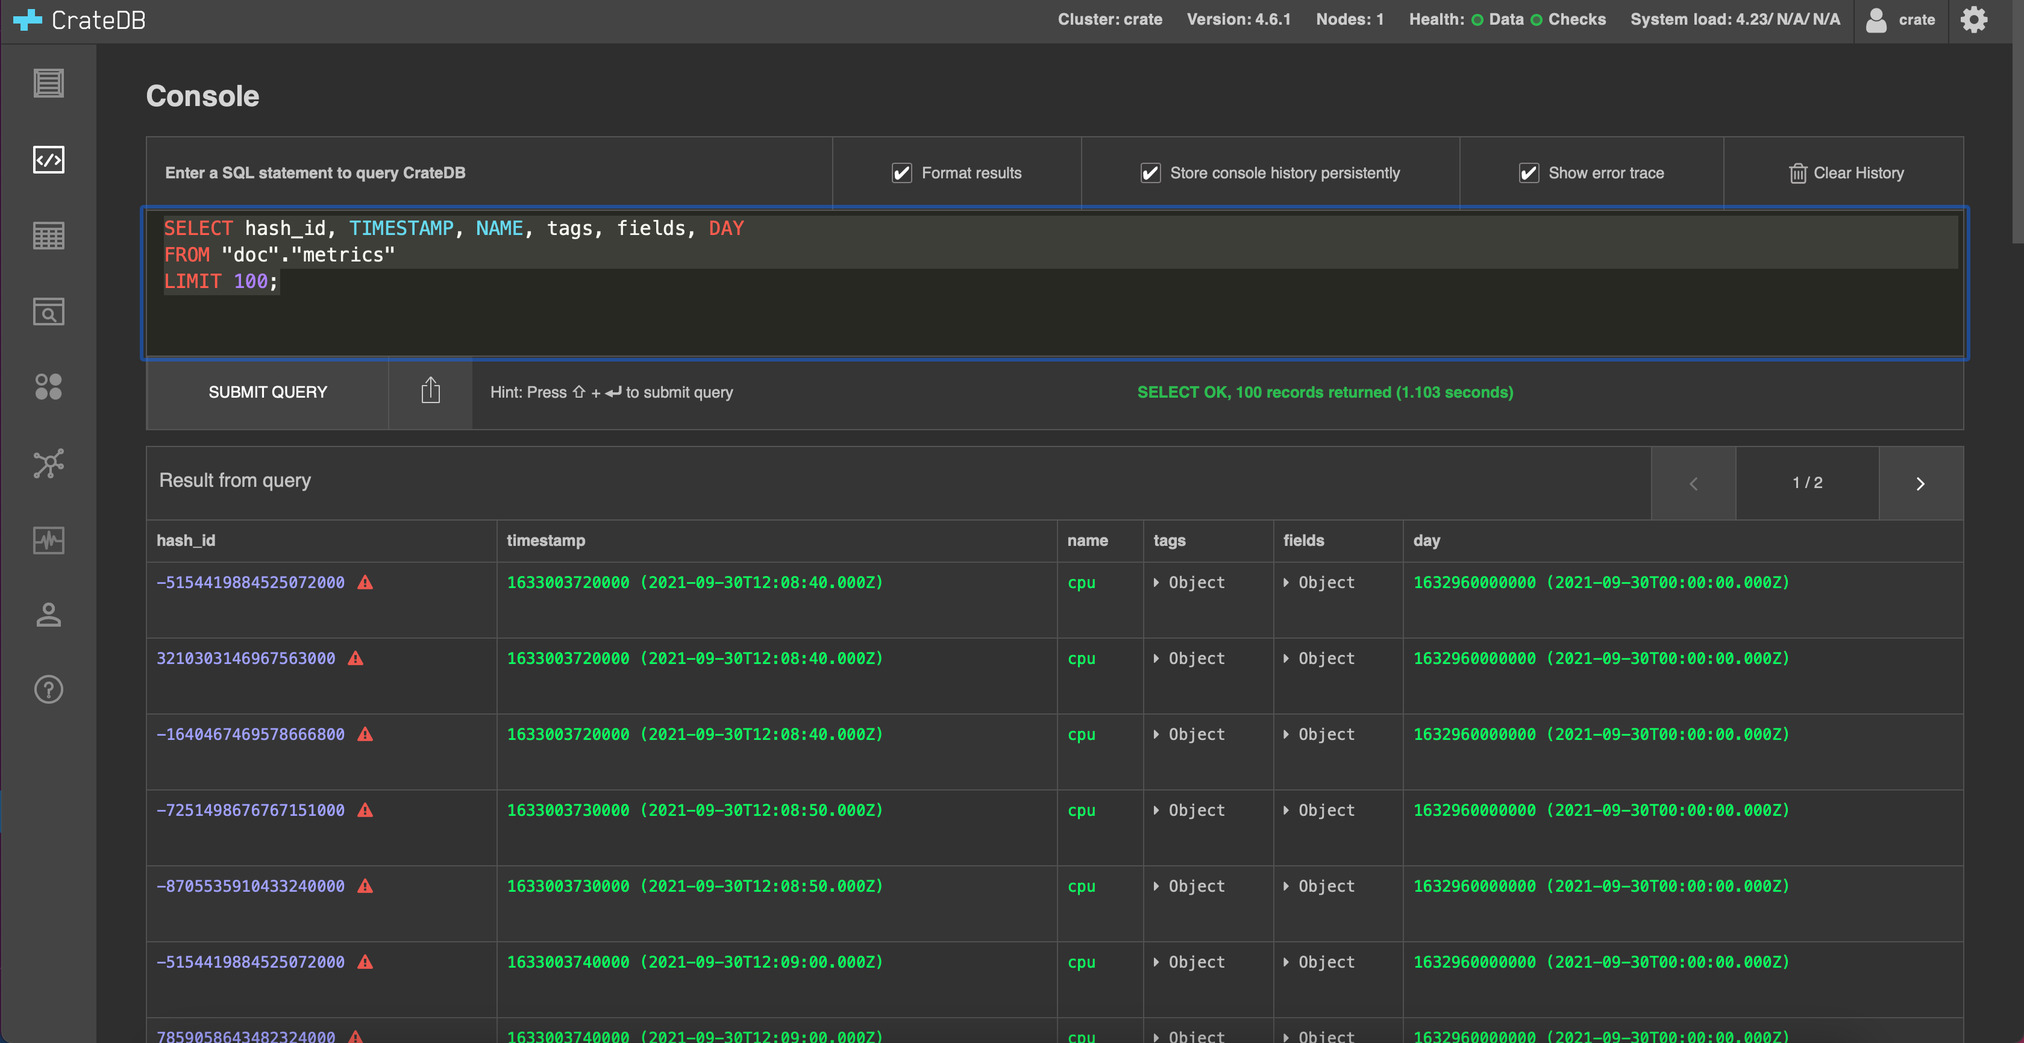
However, this row visualization is not always ideal. Therefore, I’m using Grafana to visualize my CPU data.
Visualizing the collected data with Grafana
Grafana is an open-source solution for performing data analysis, retrieving metrics that add value to the huge amount of data, and monitoring applications using customizable dashboards.
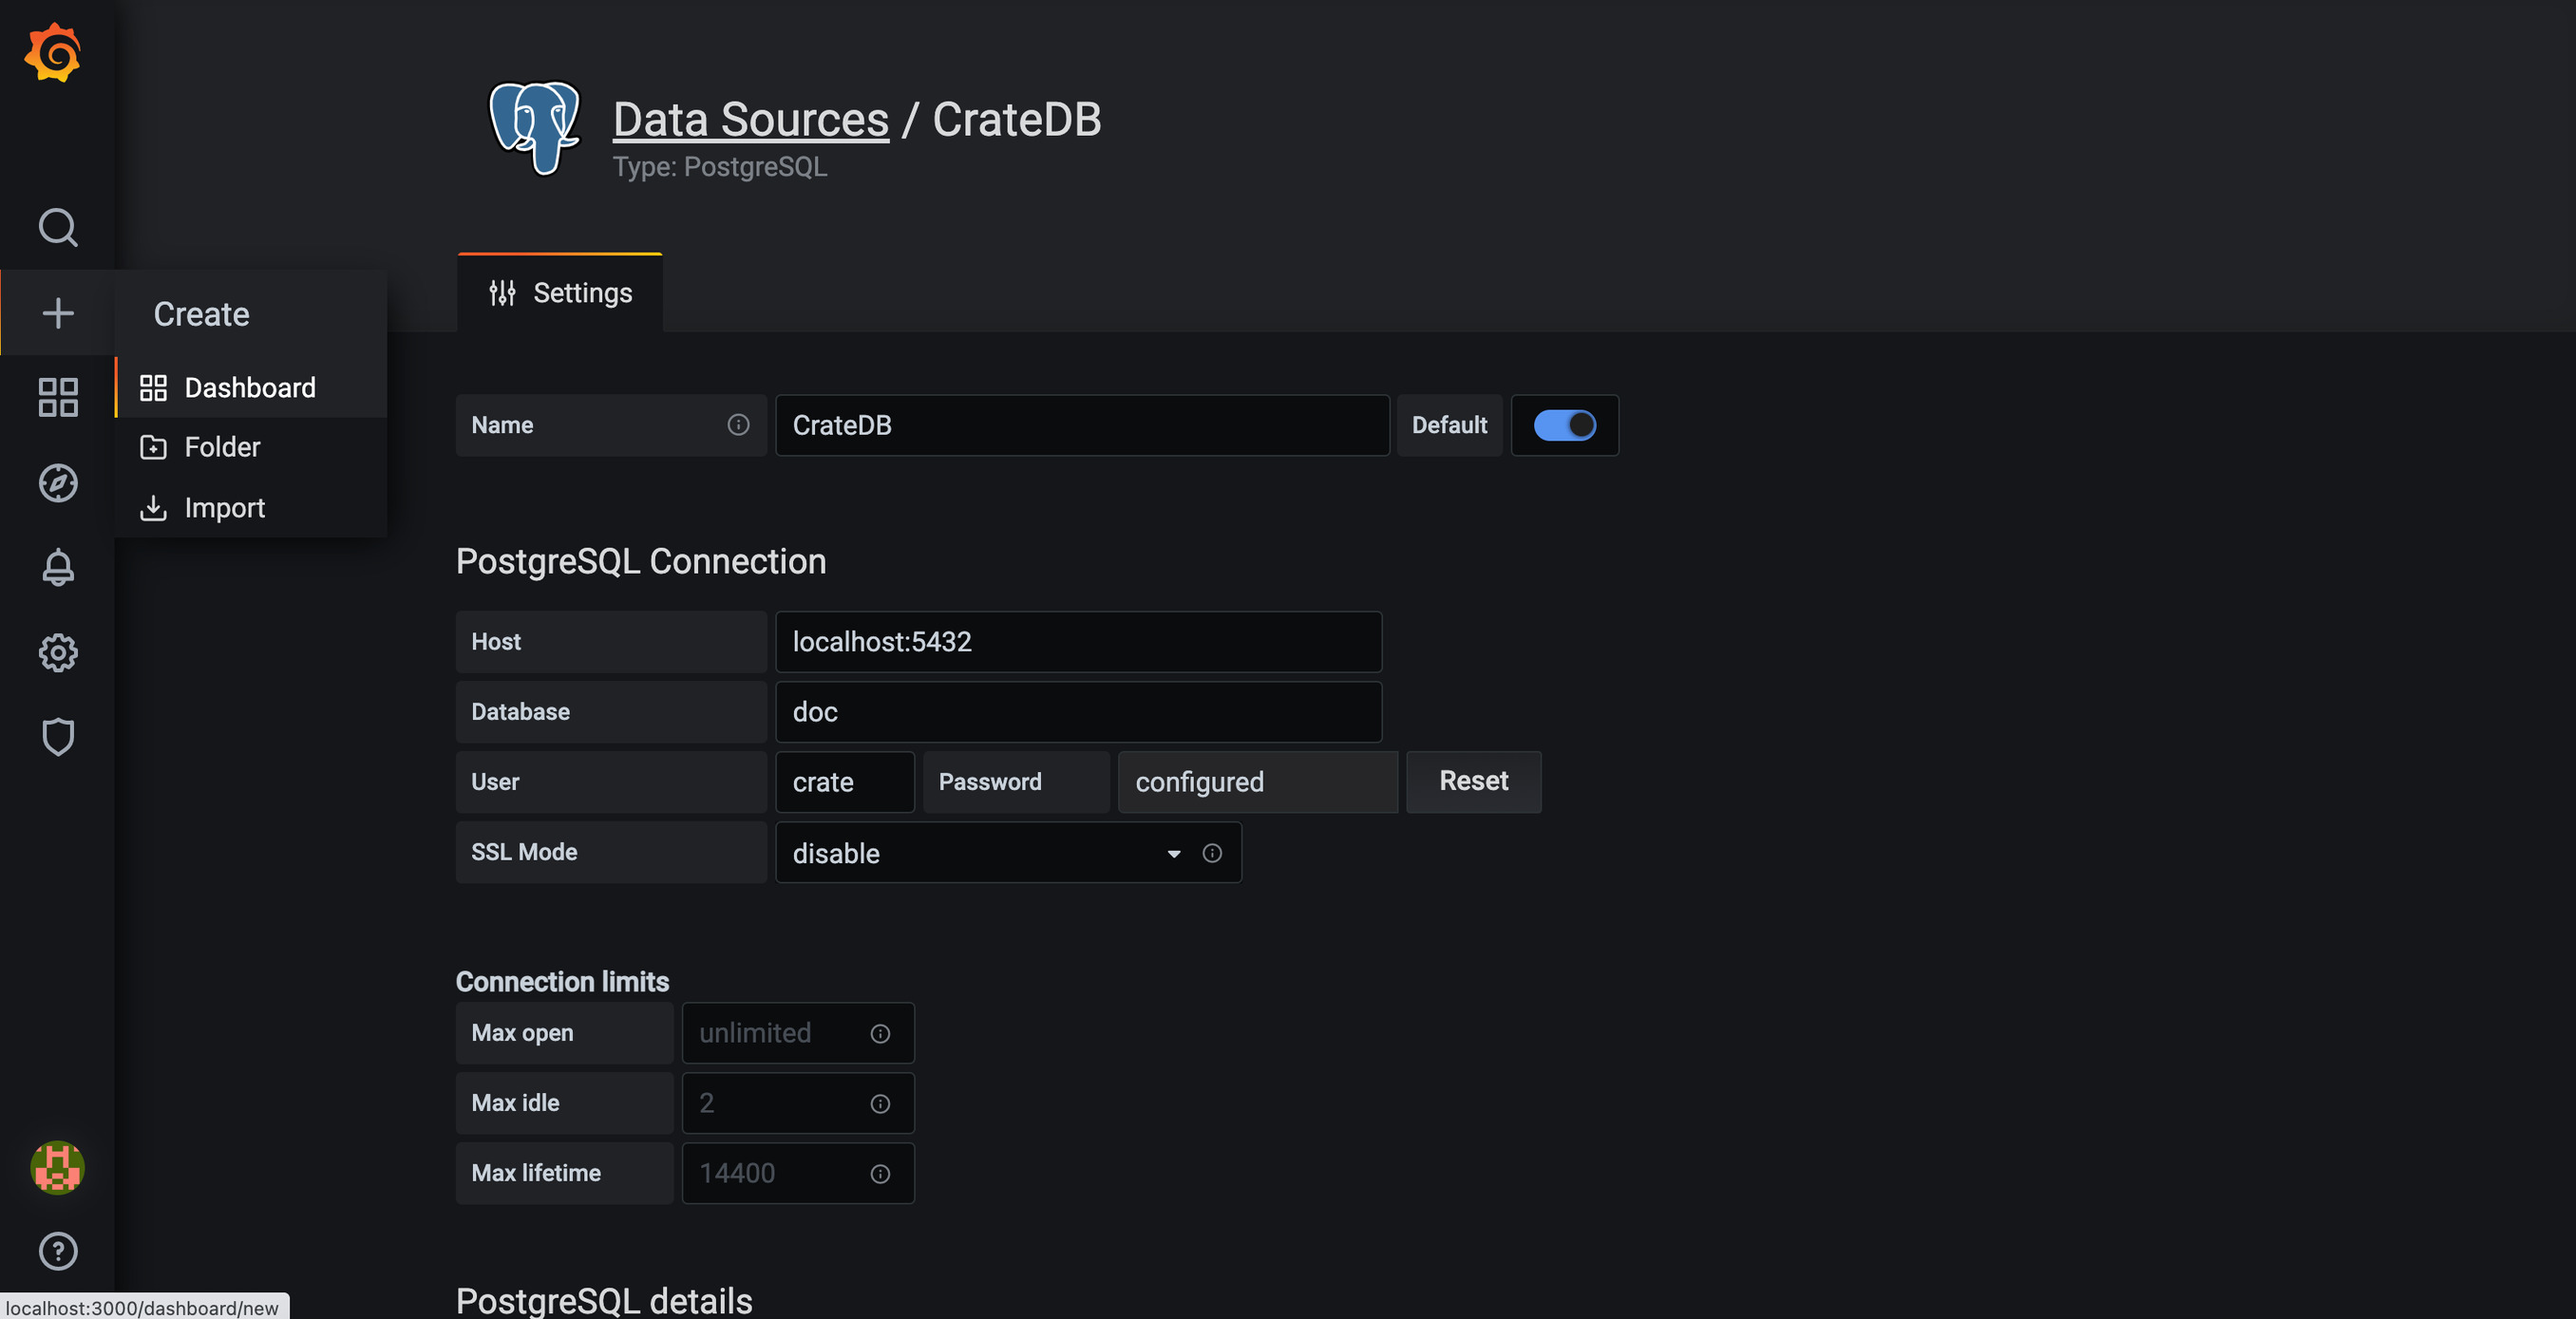
I followed the CrateDB with Grafana tutorial to learn about how to install Grafana and get the first connection to CrateDB.
Once the connection to CrateDB is established, I navigate to the + icon on the left side to create a new dashboard:
I click on the Add new panel option, which opens a new panel window:
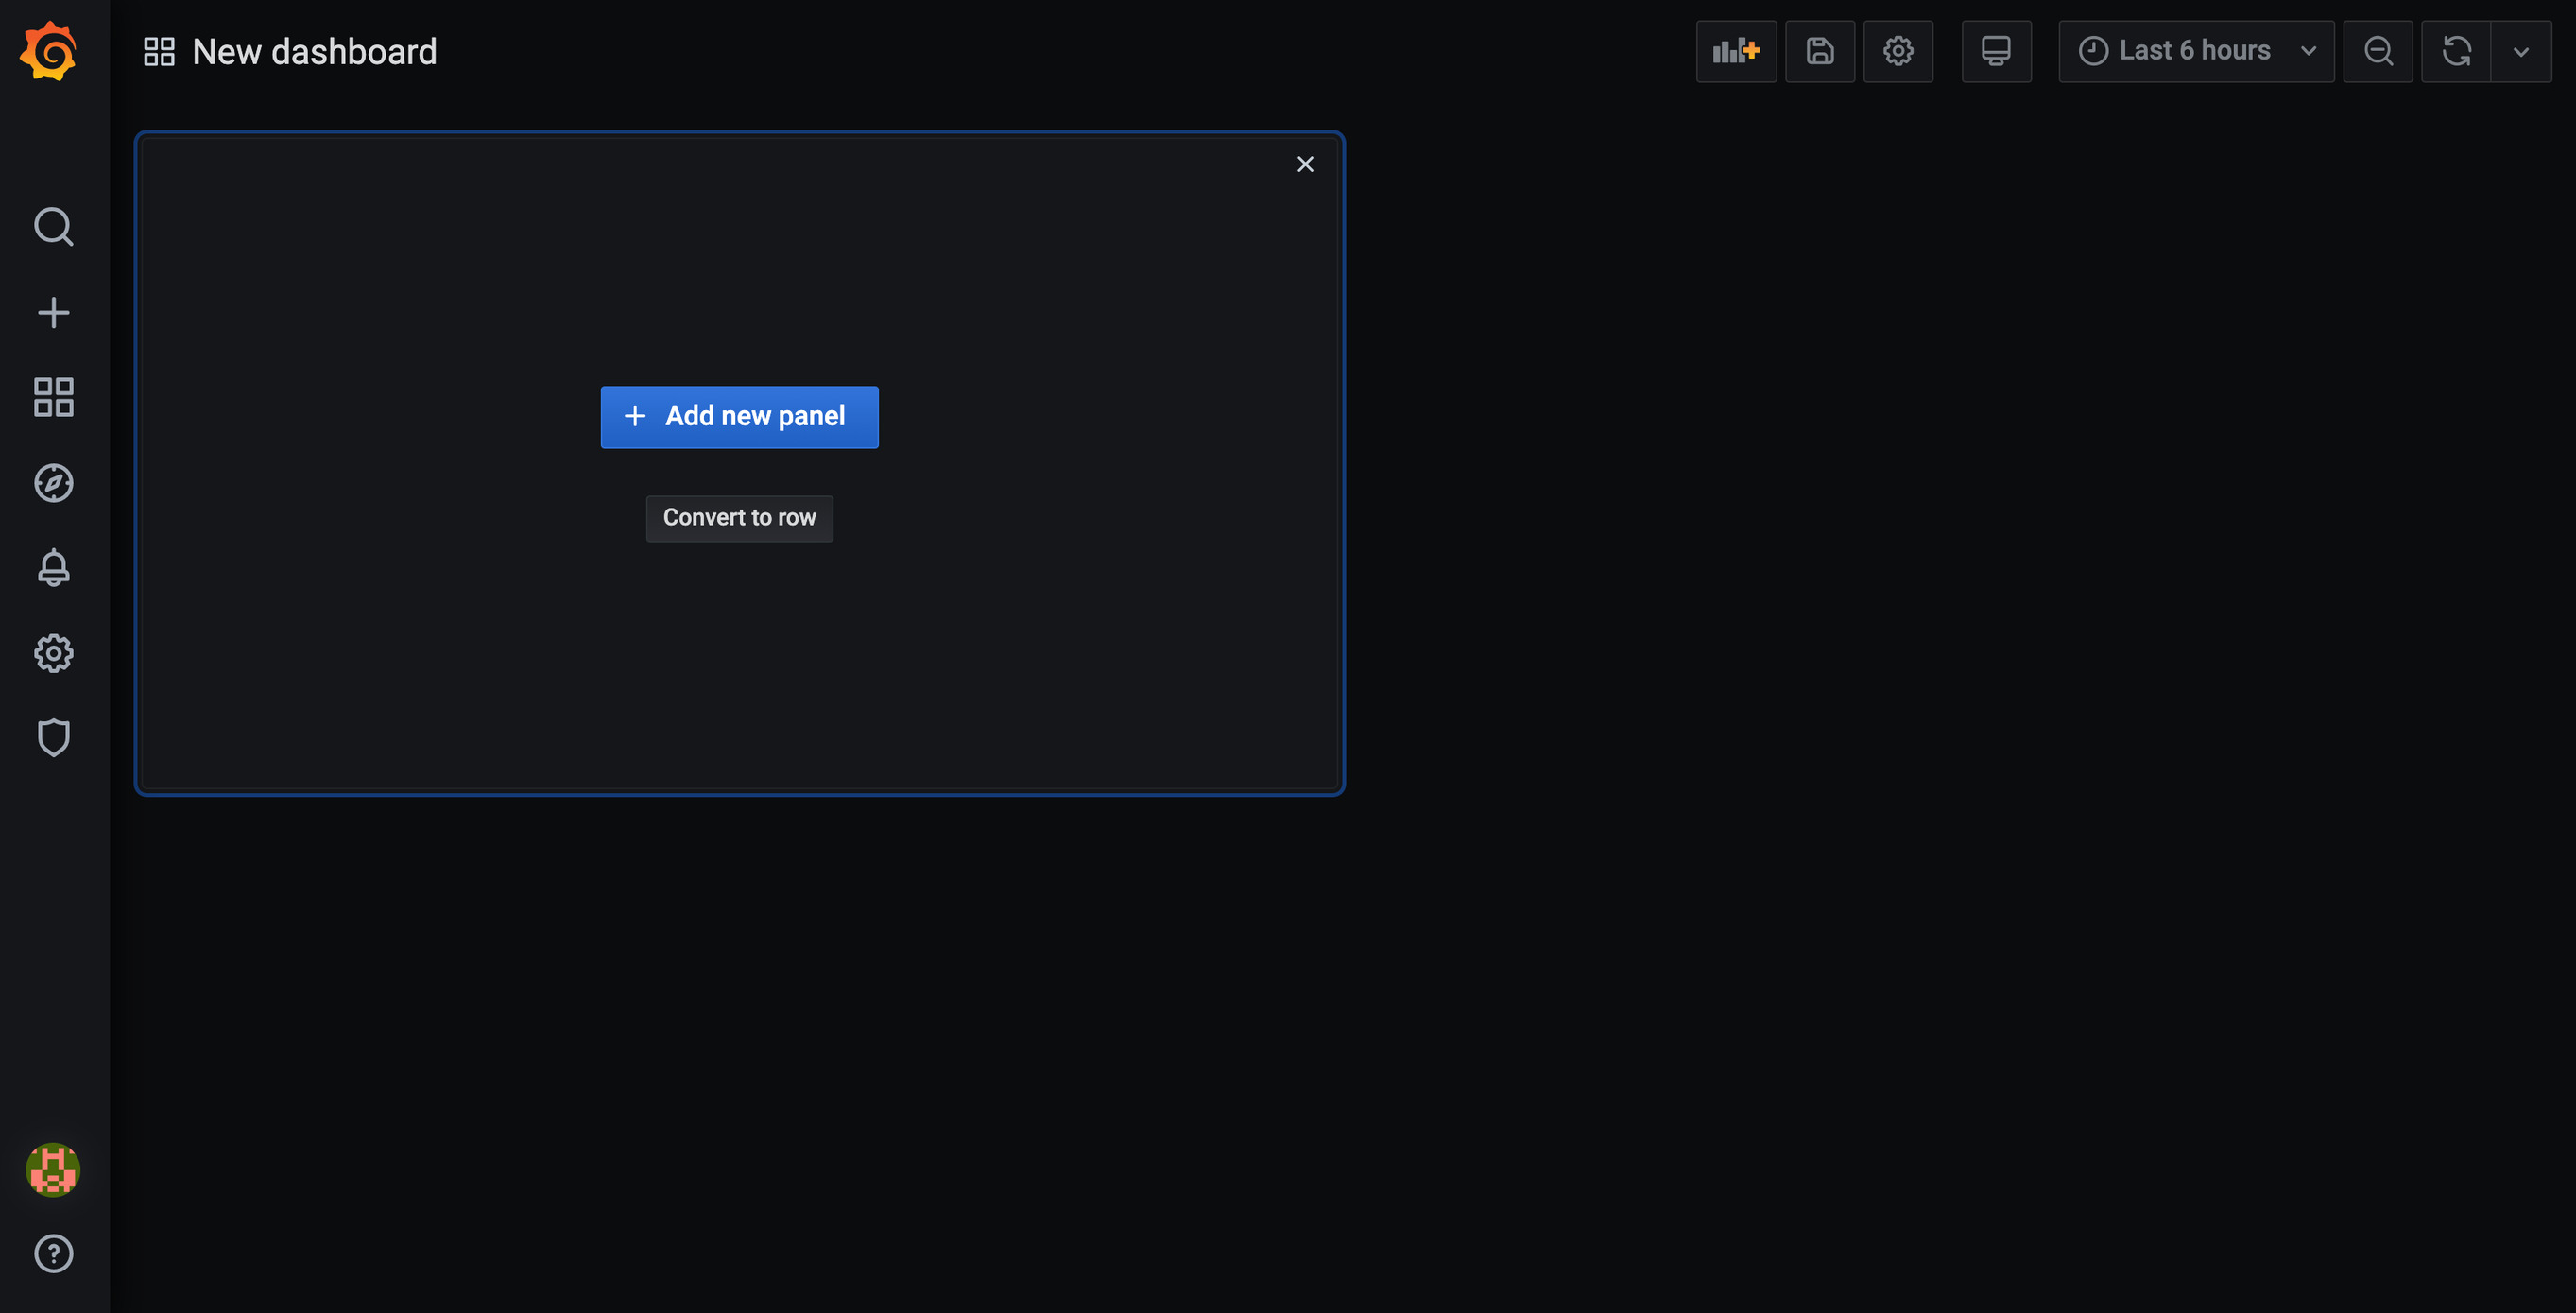
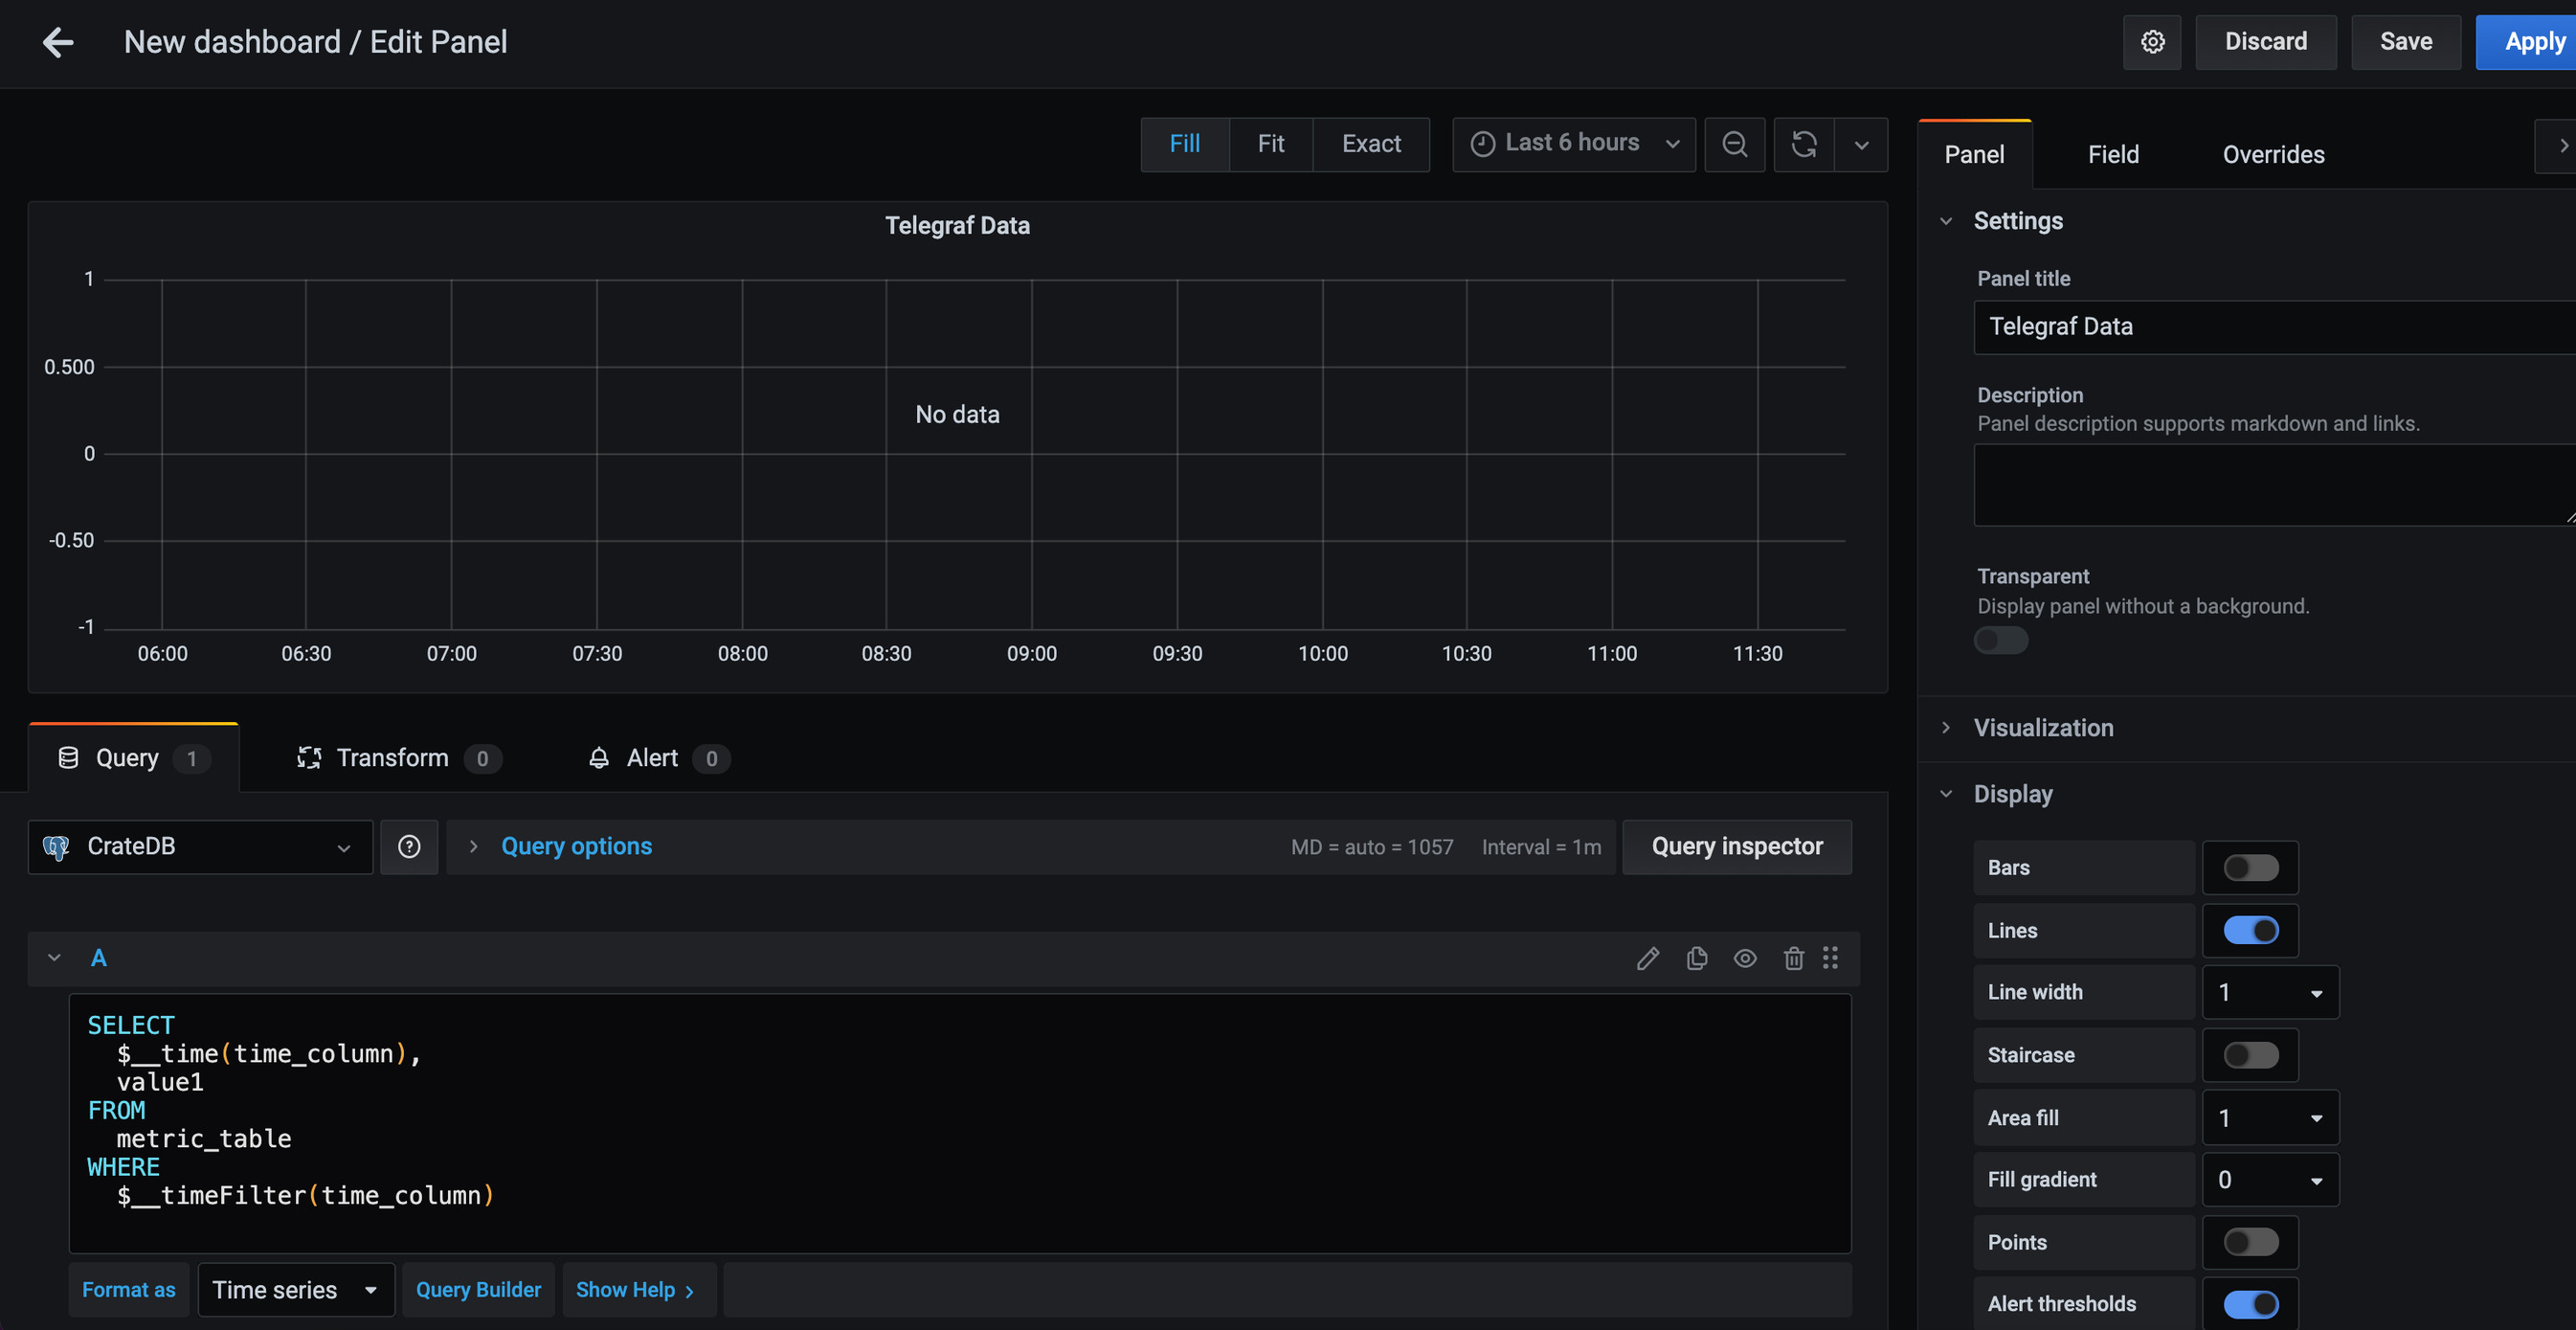
First, I give a name to this panel by editing the Panel title on the upper right-hand side.
Grafana created a default query called A, which I find at the bottom of this page.
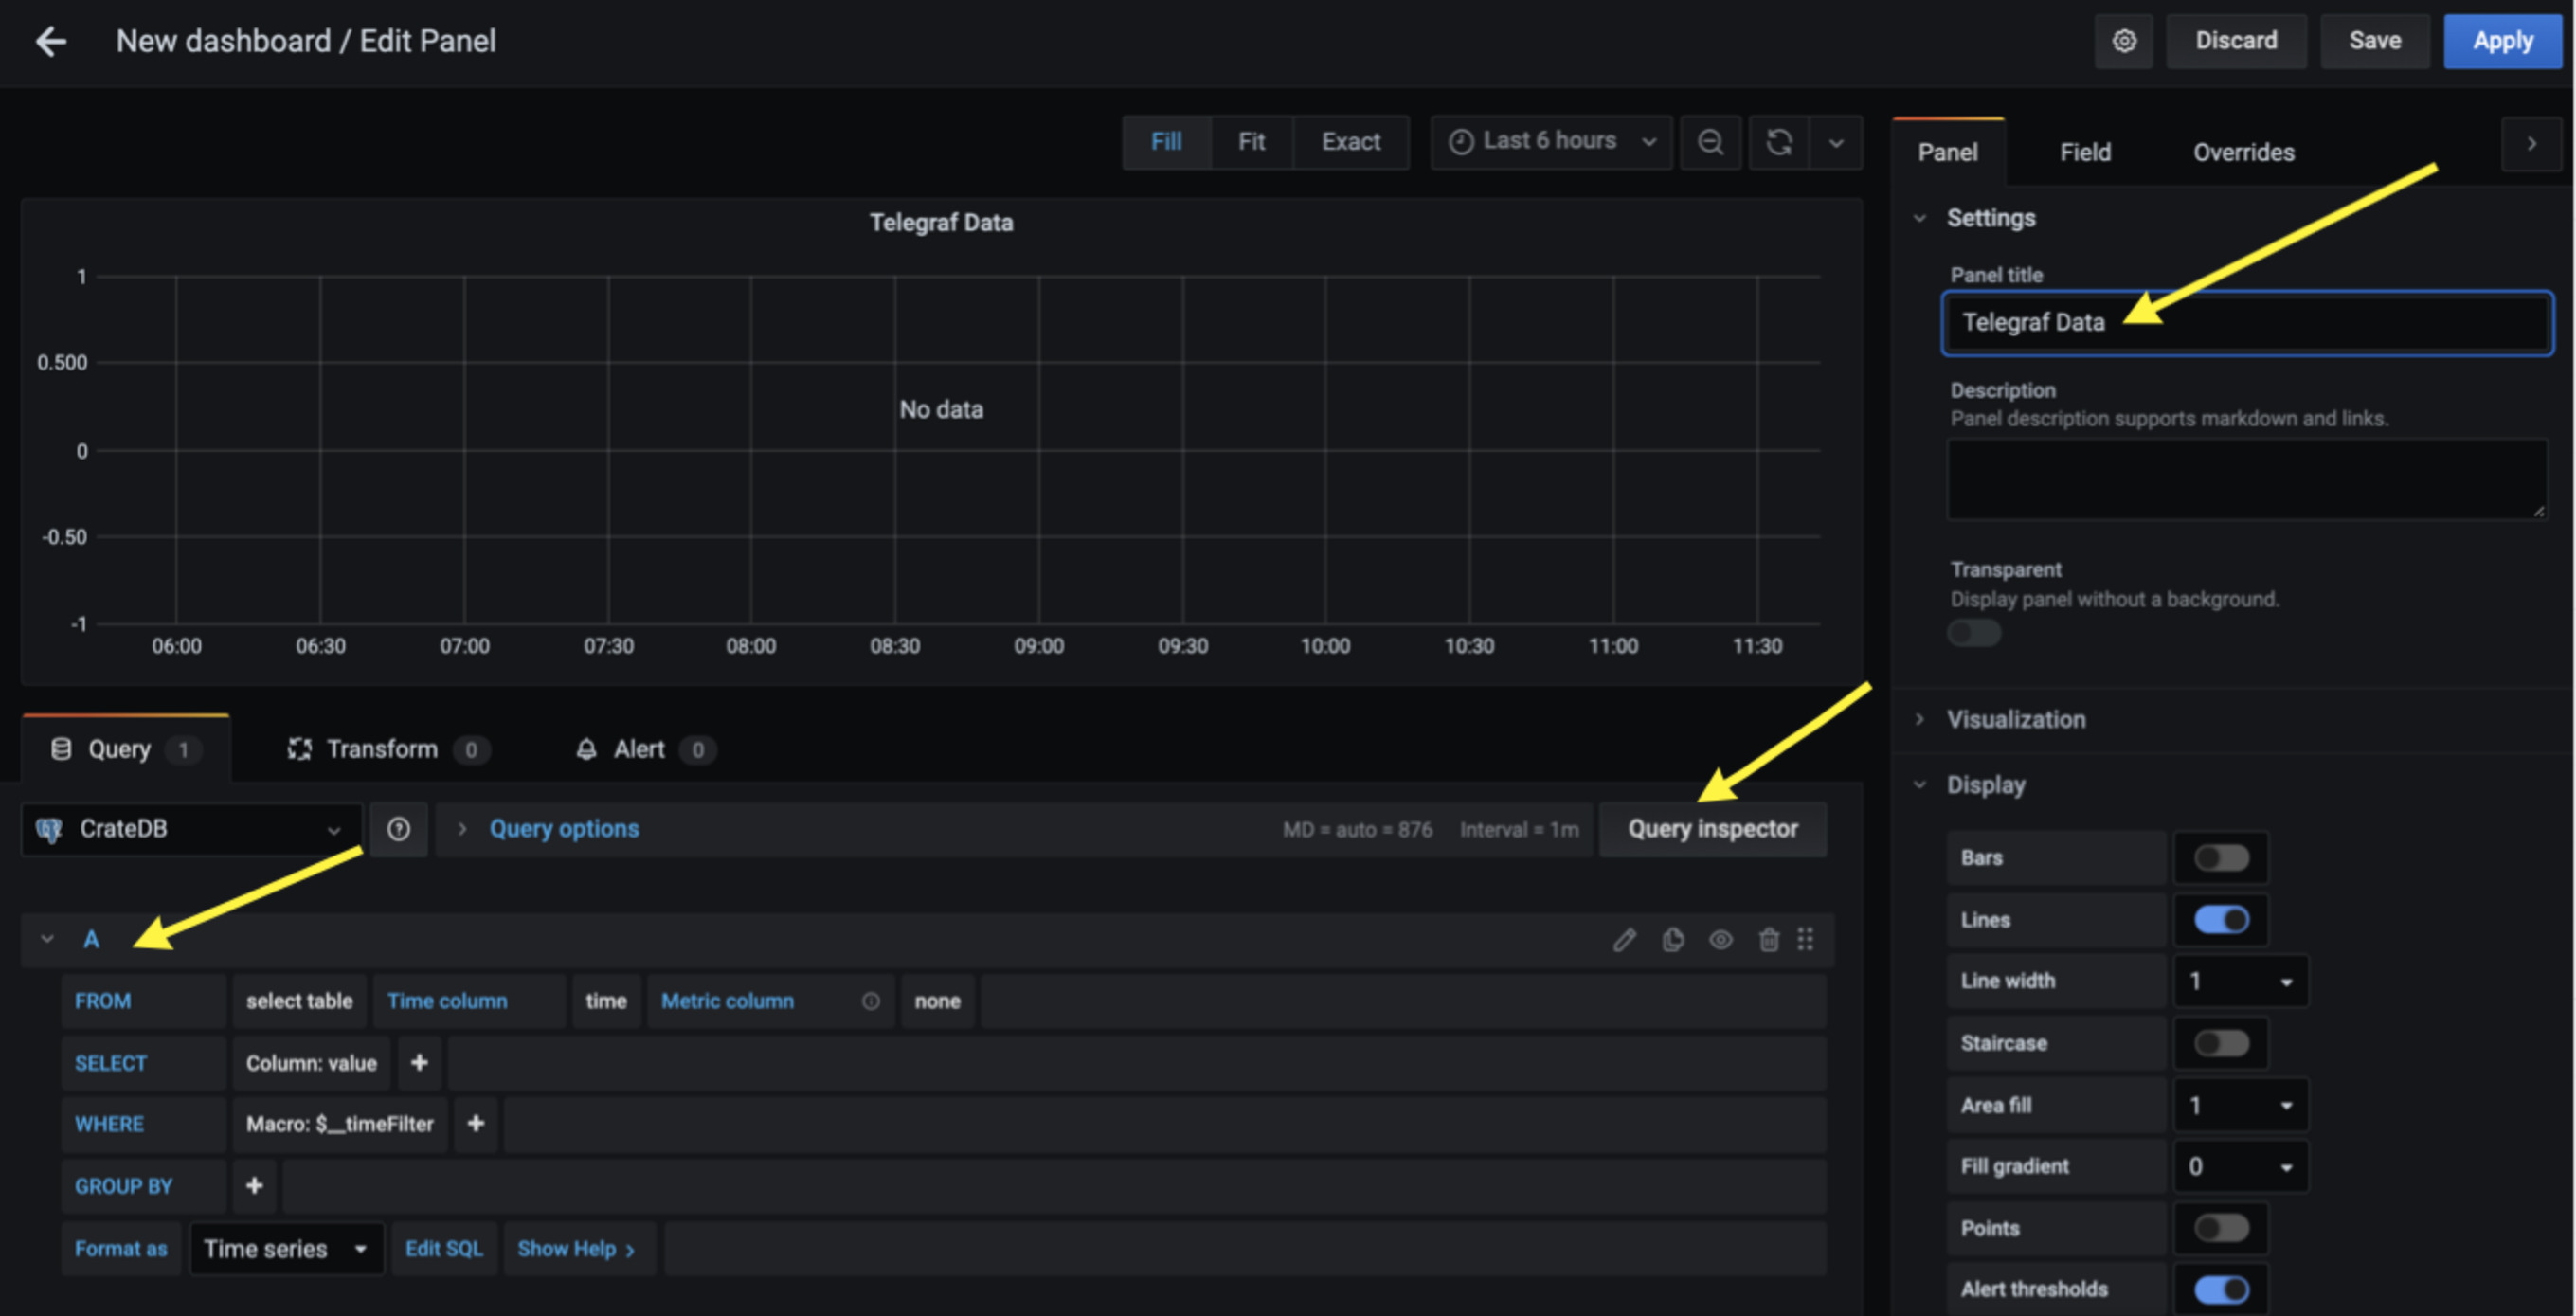
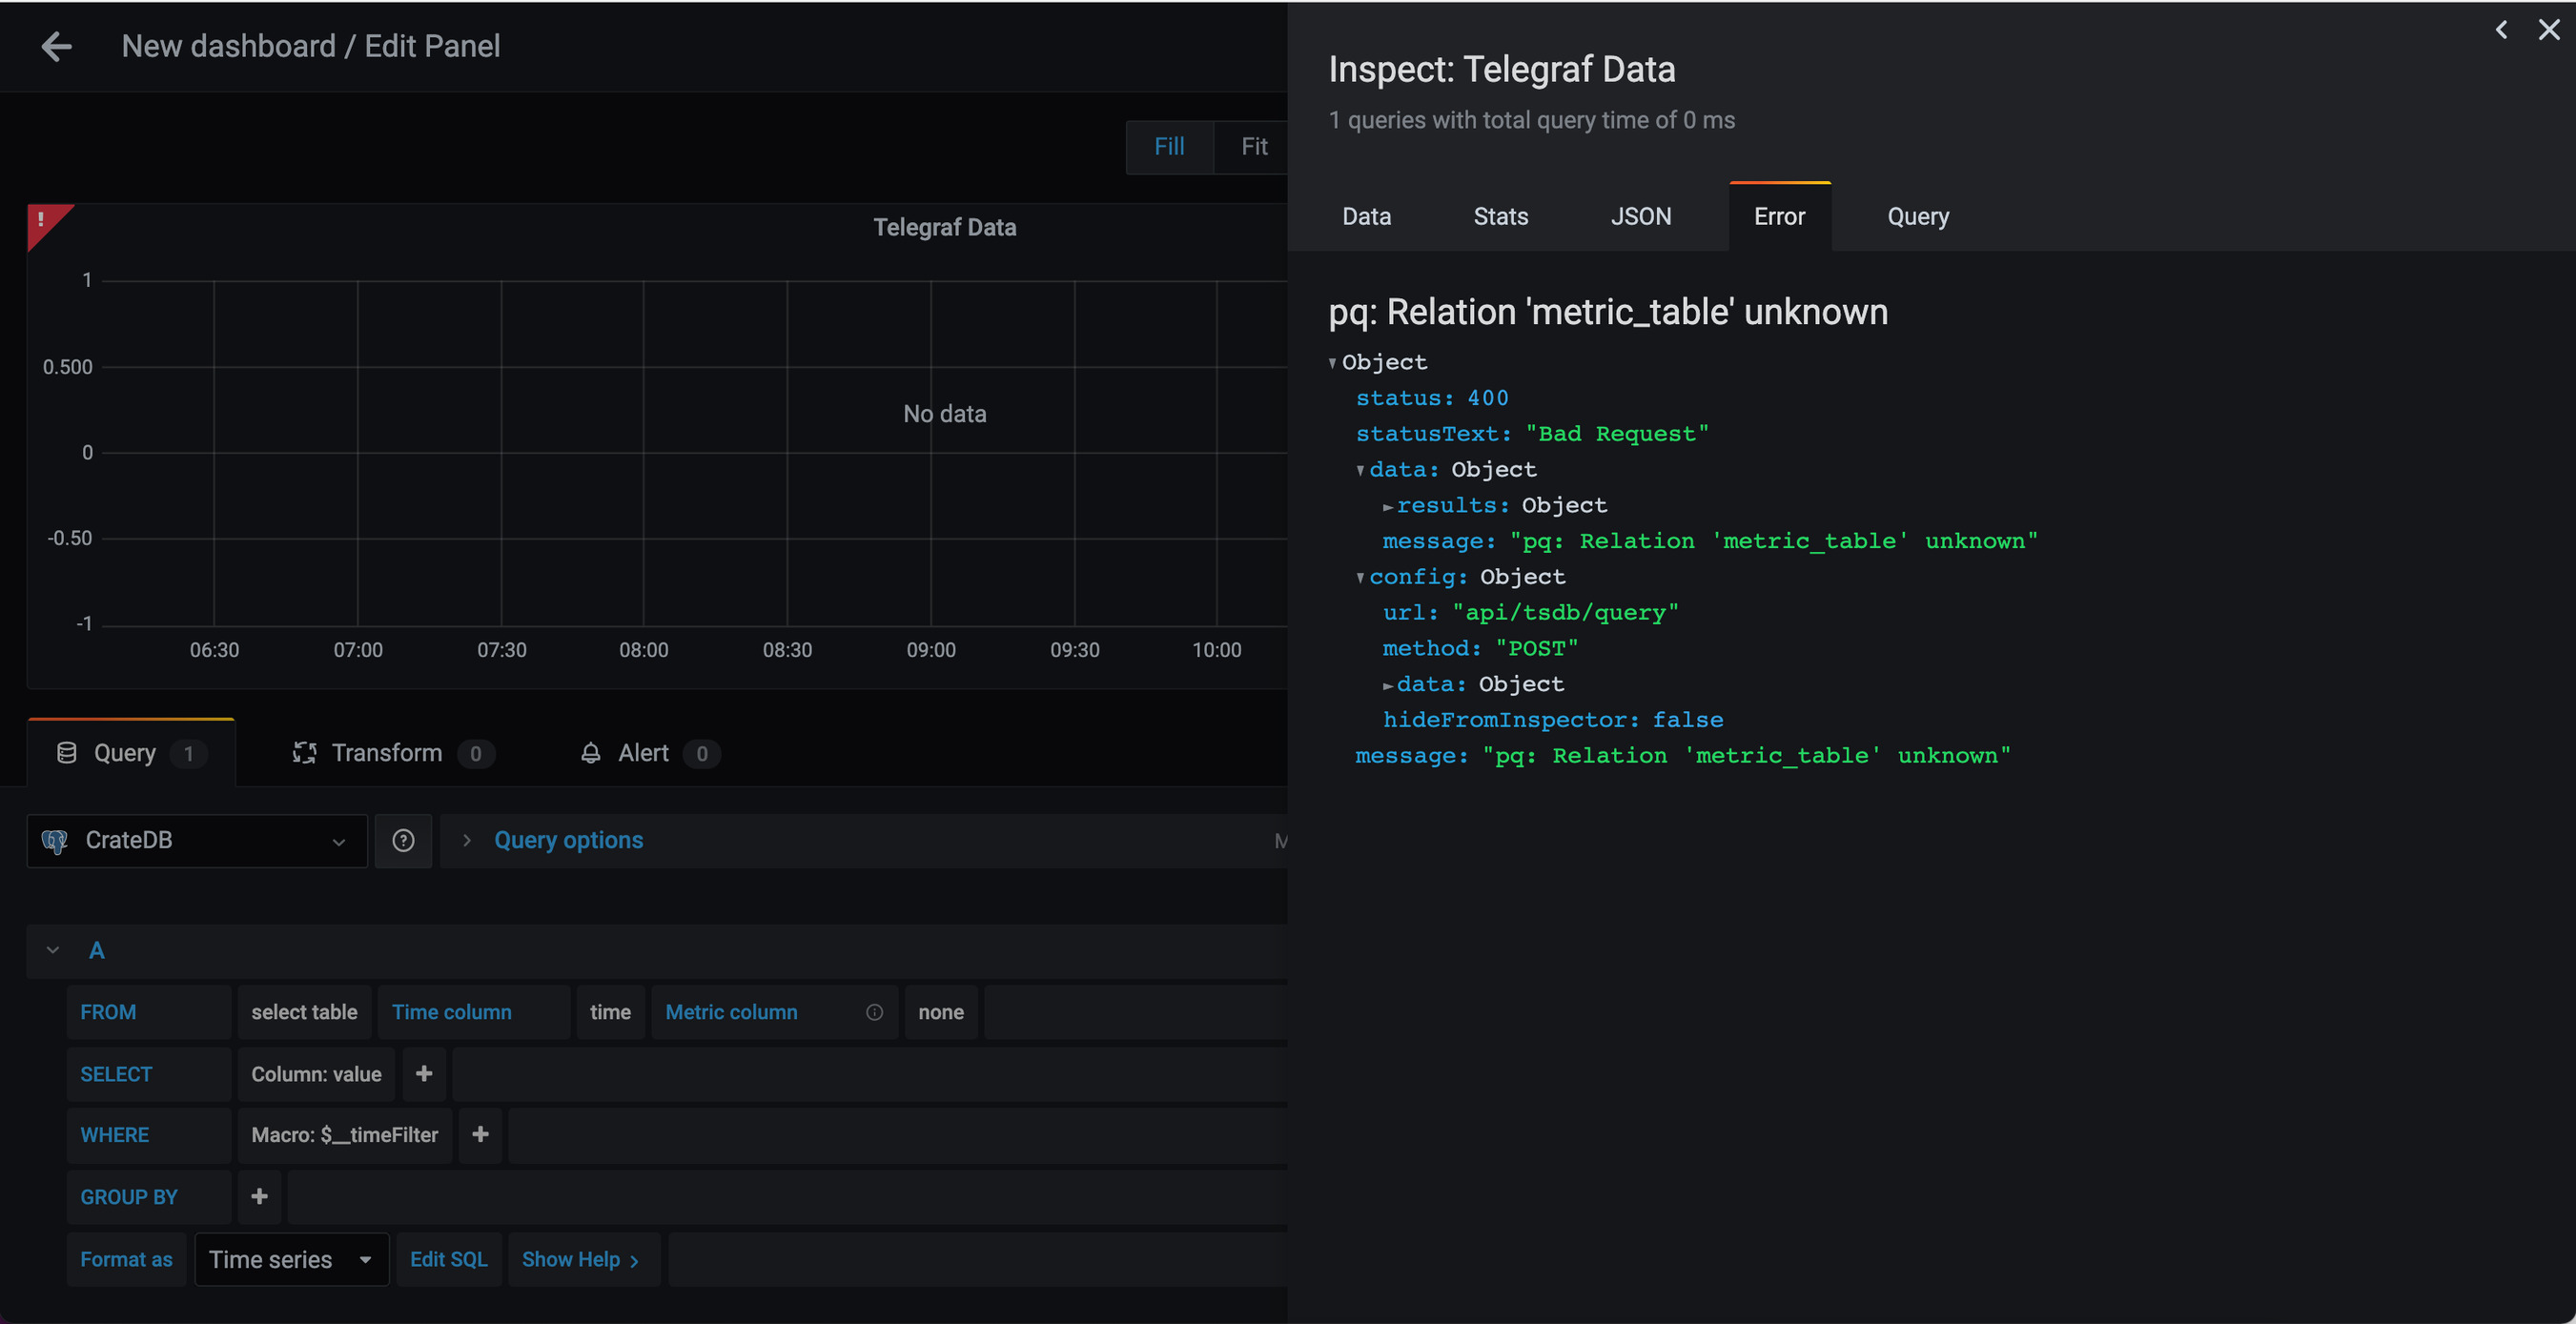
When I navigate to the Query inspector option, a new window pops up, and when I click on the Error tab I see that this default query does not match the data Grafana collected:
So I will edit the SQL Query to fit my data: I head back to the default query and select the Edit SQL option:
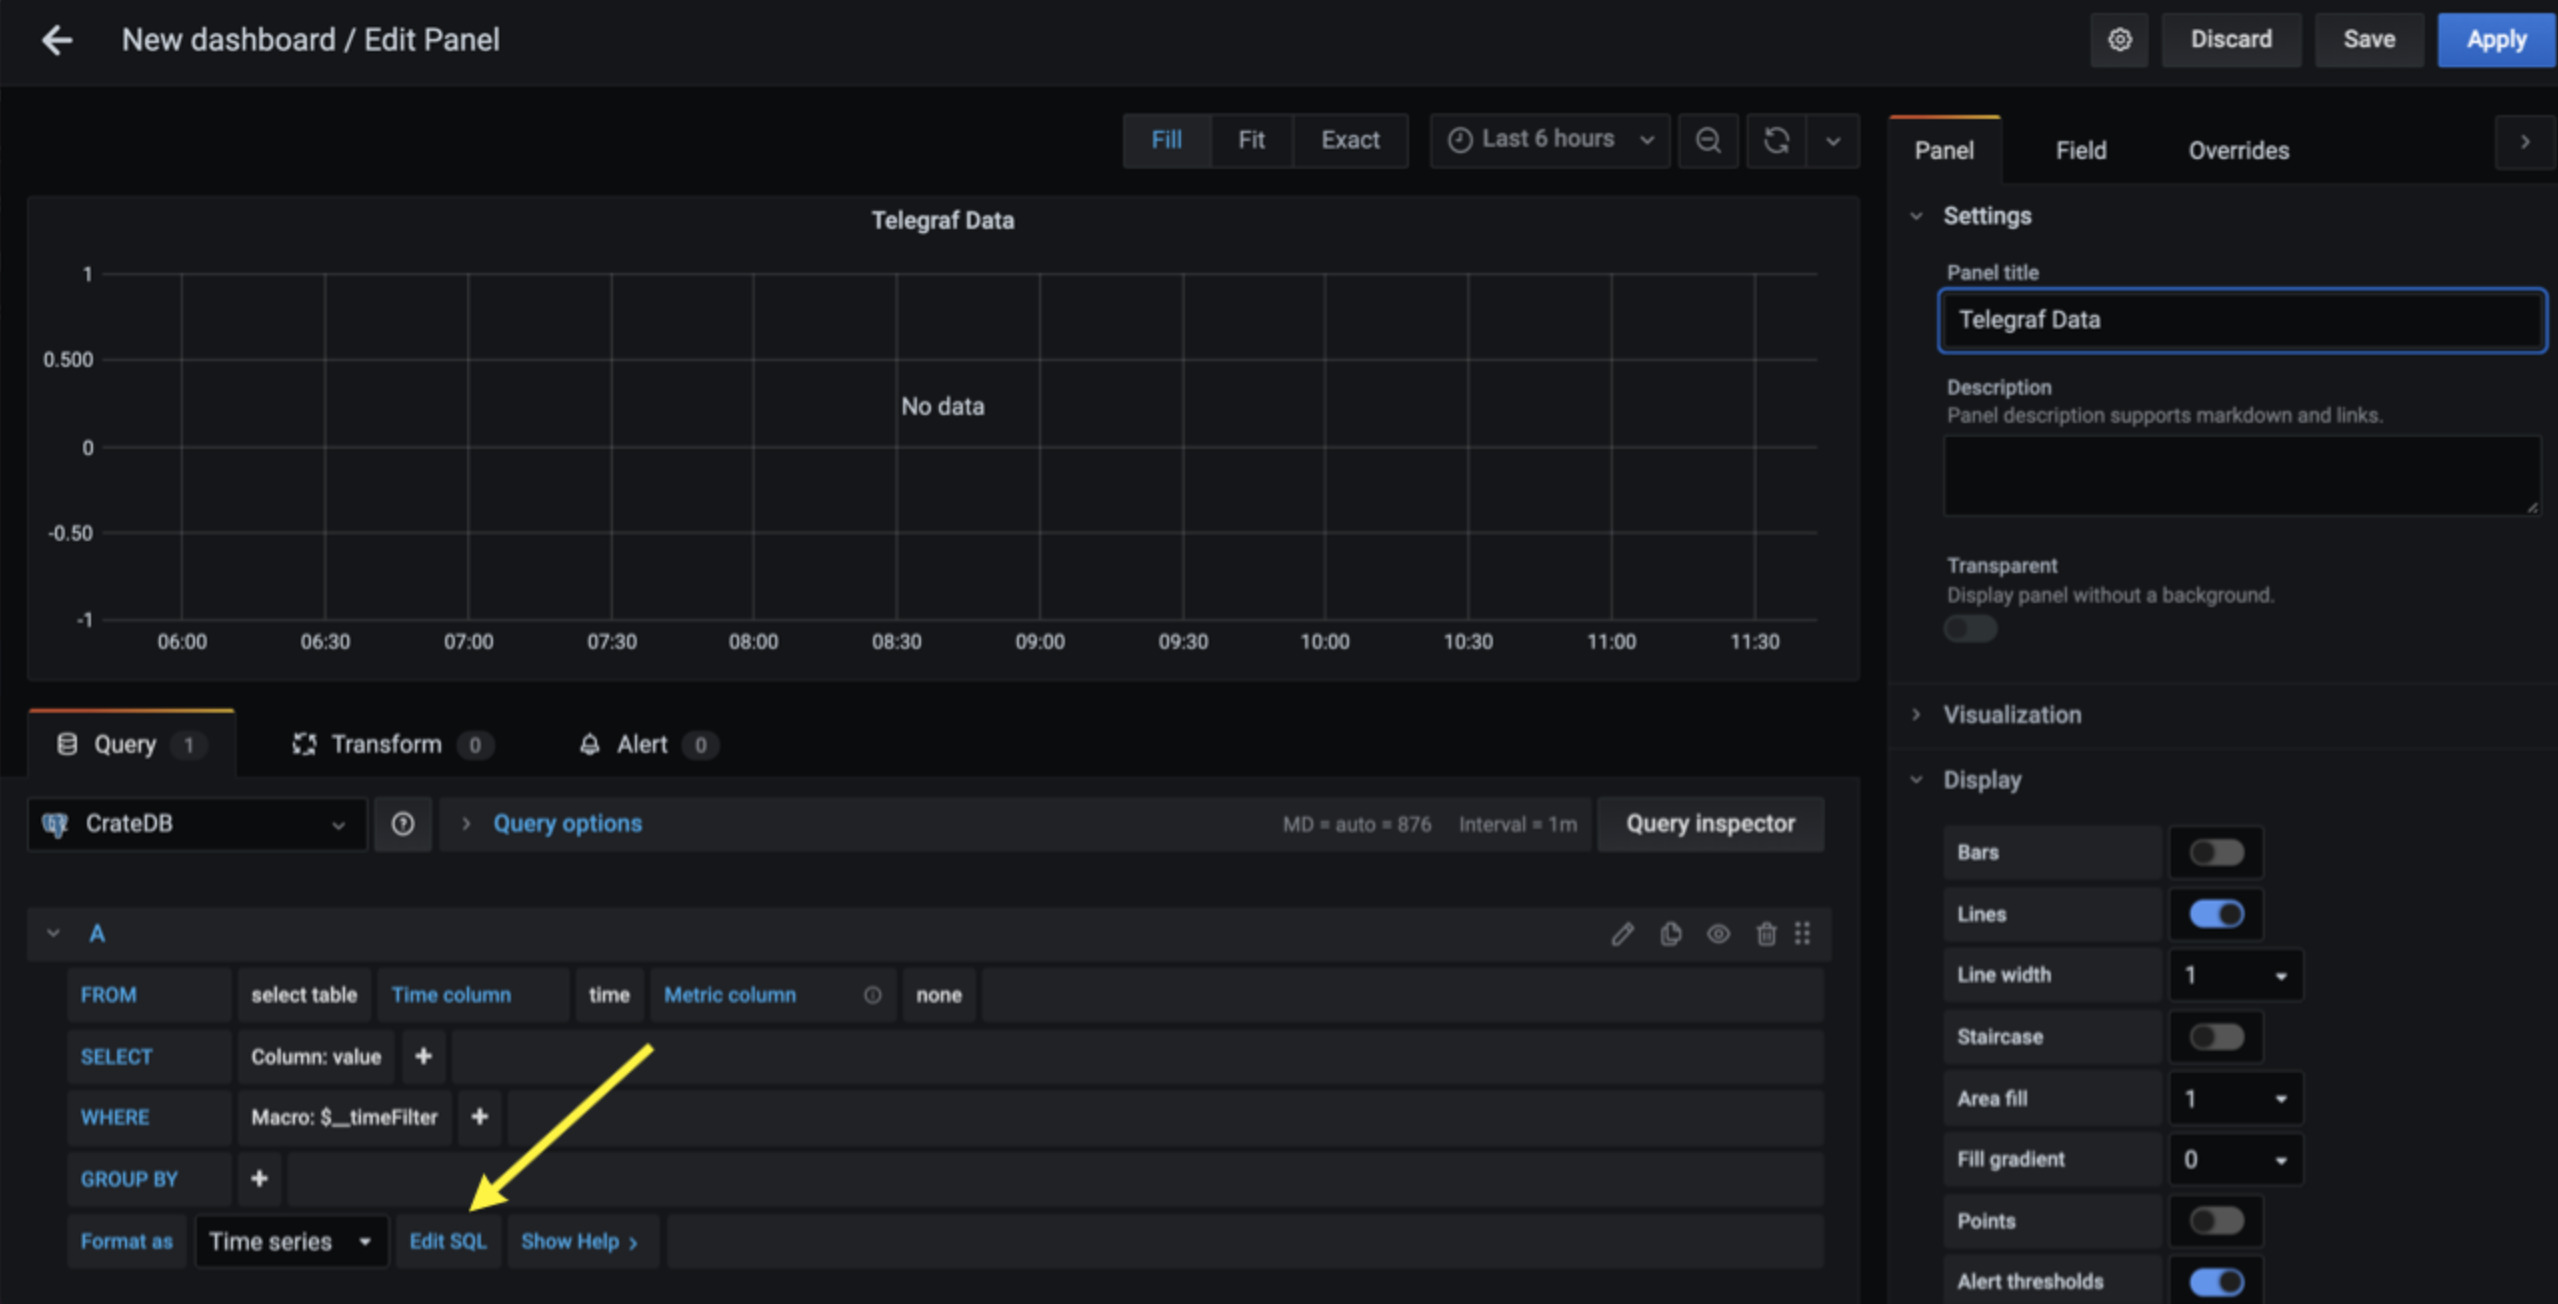
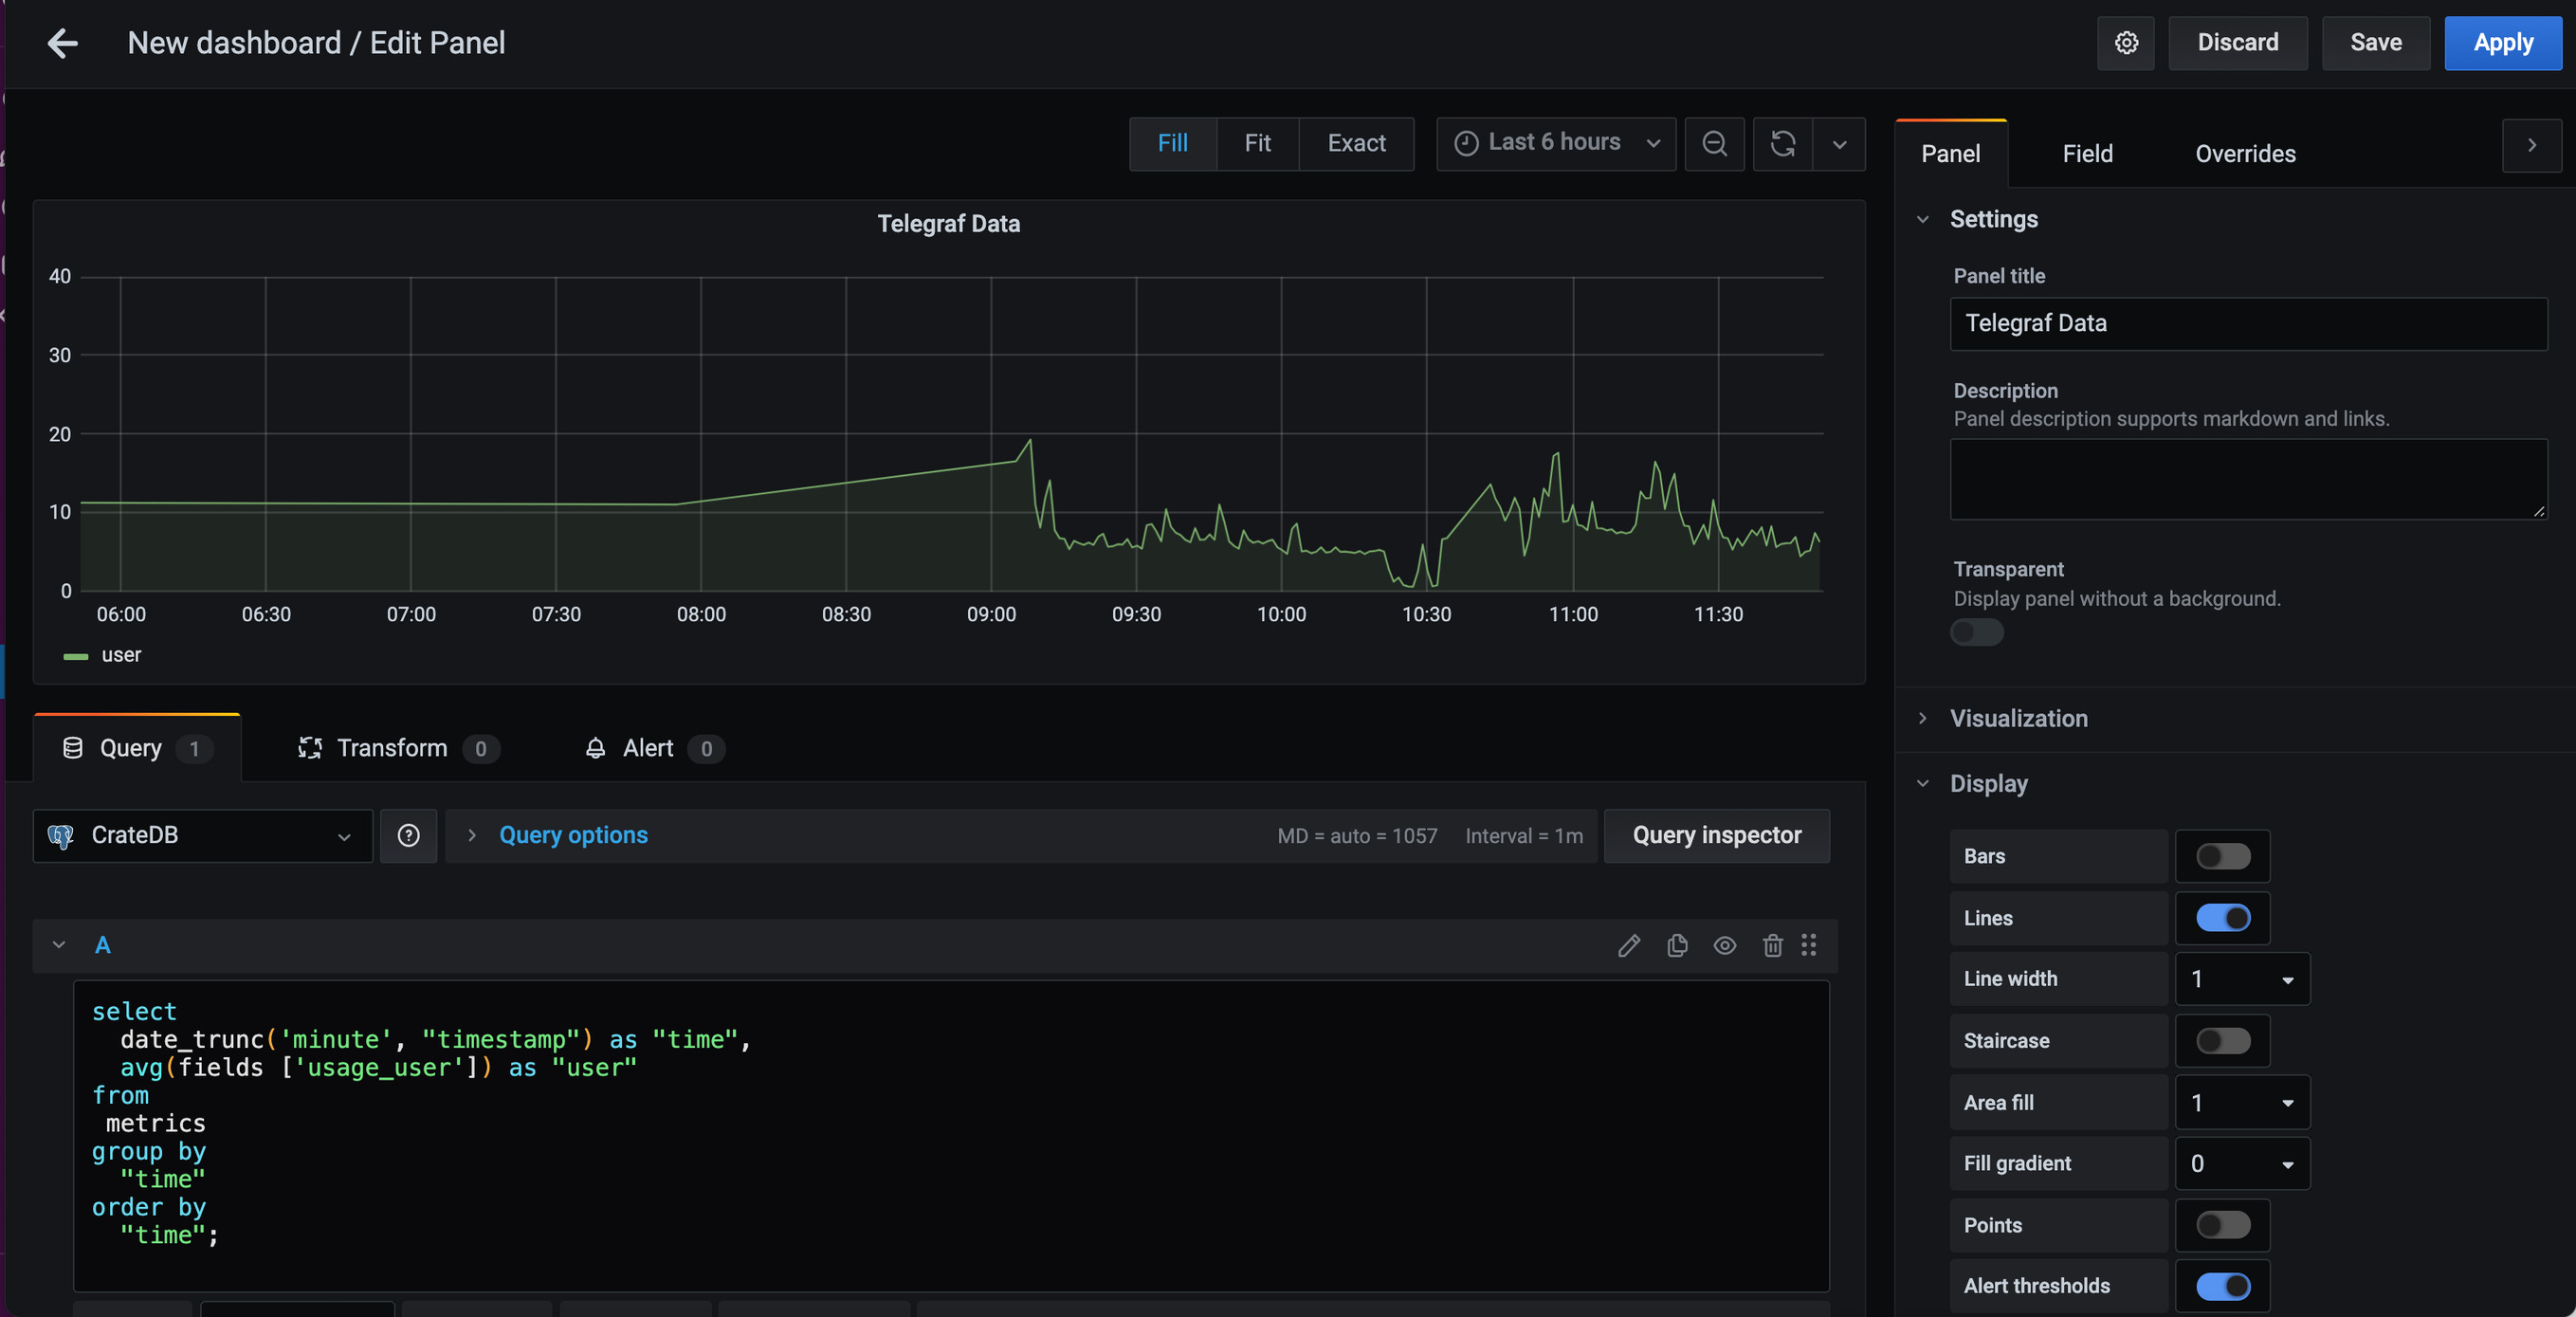
The current SQL query is displayed, and I replace it with a custom Query for the Grafana data:
SELECT
  date_trunc('minute', "timestamp") as "time",
  avg(fields ['usage_user']) as "user"
FROM
  metrics
GROUP BY
  "time"
ORDER BY
  "time";
- Chunks user CPU utilization into minute-long buckets
- Outputs the average value across the whole minute
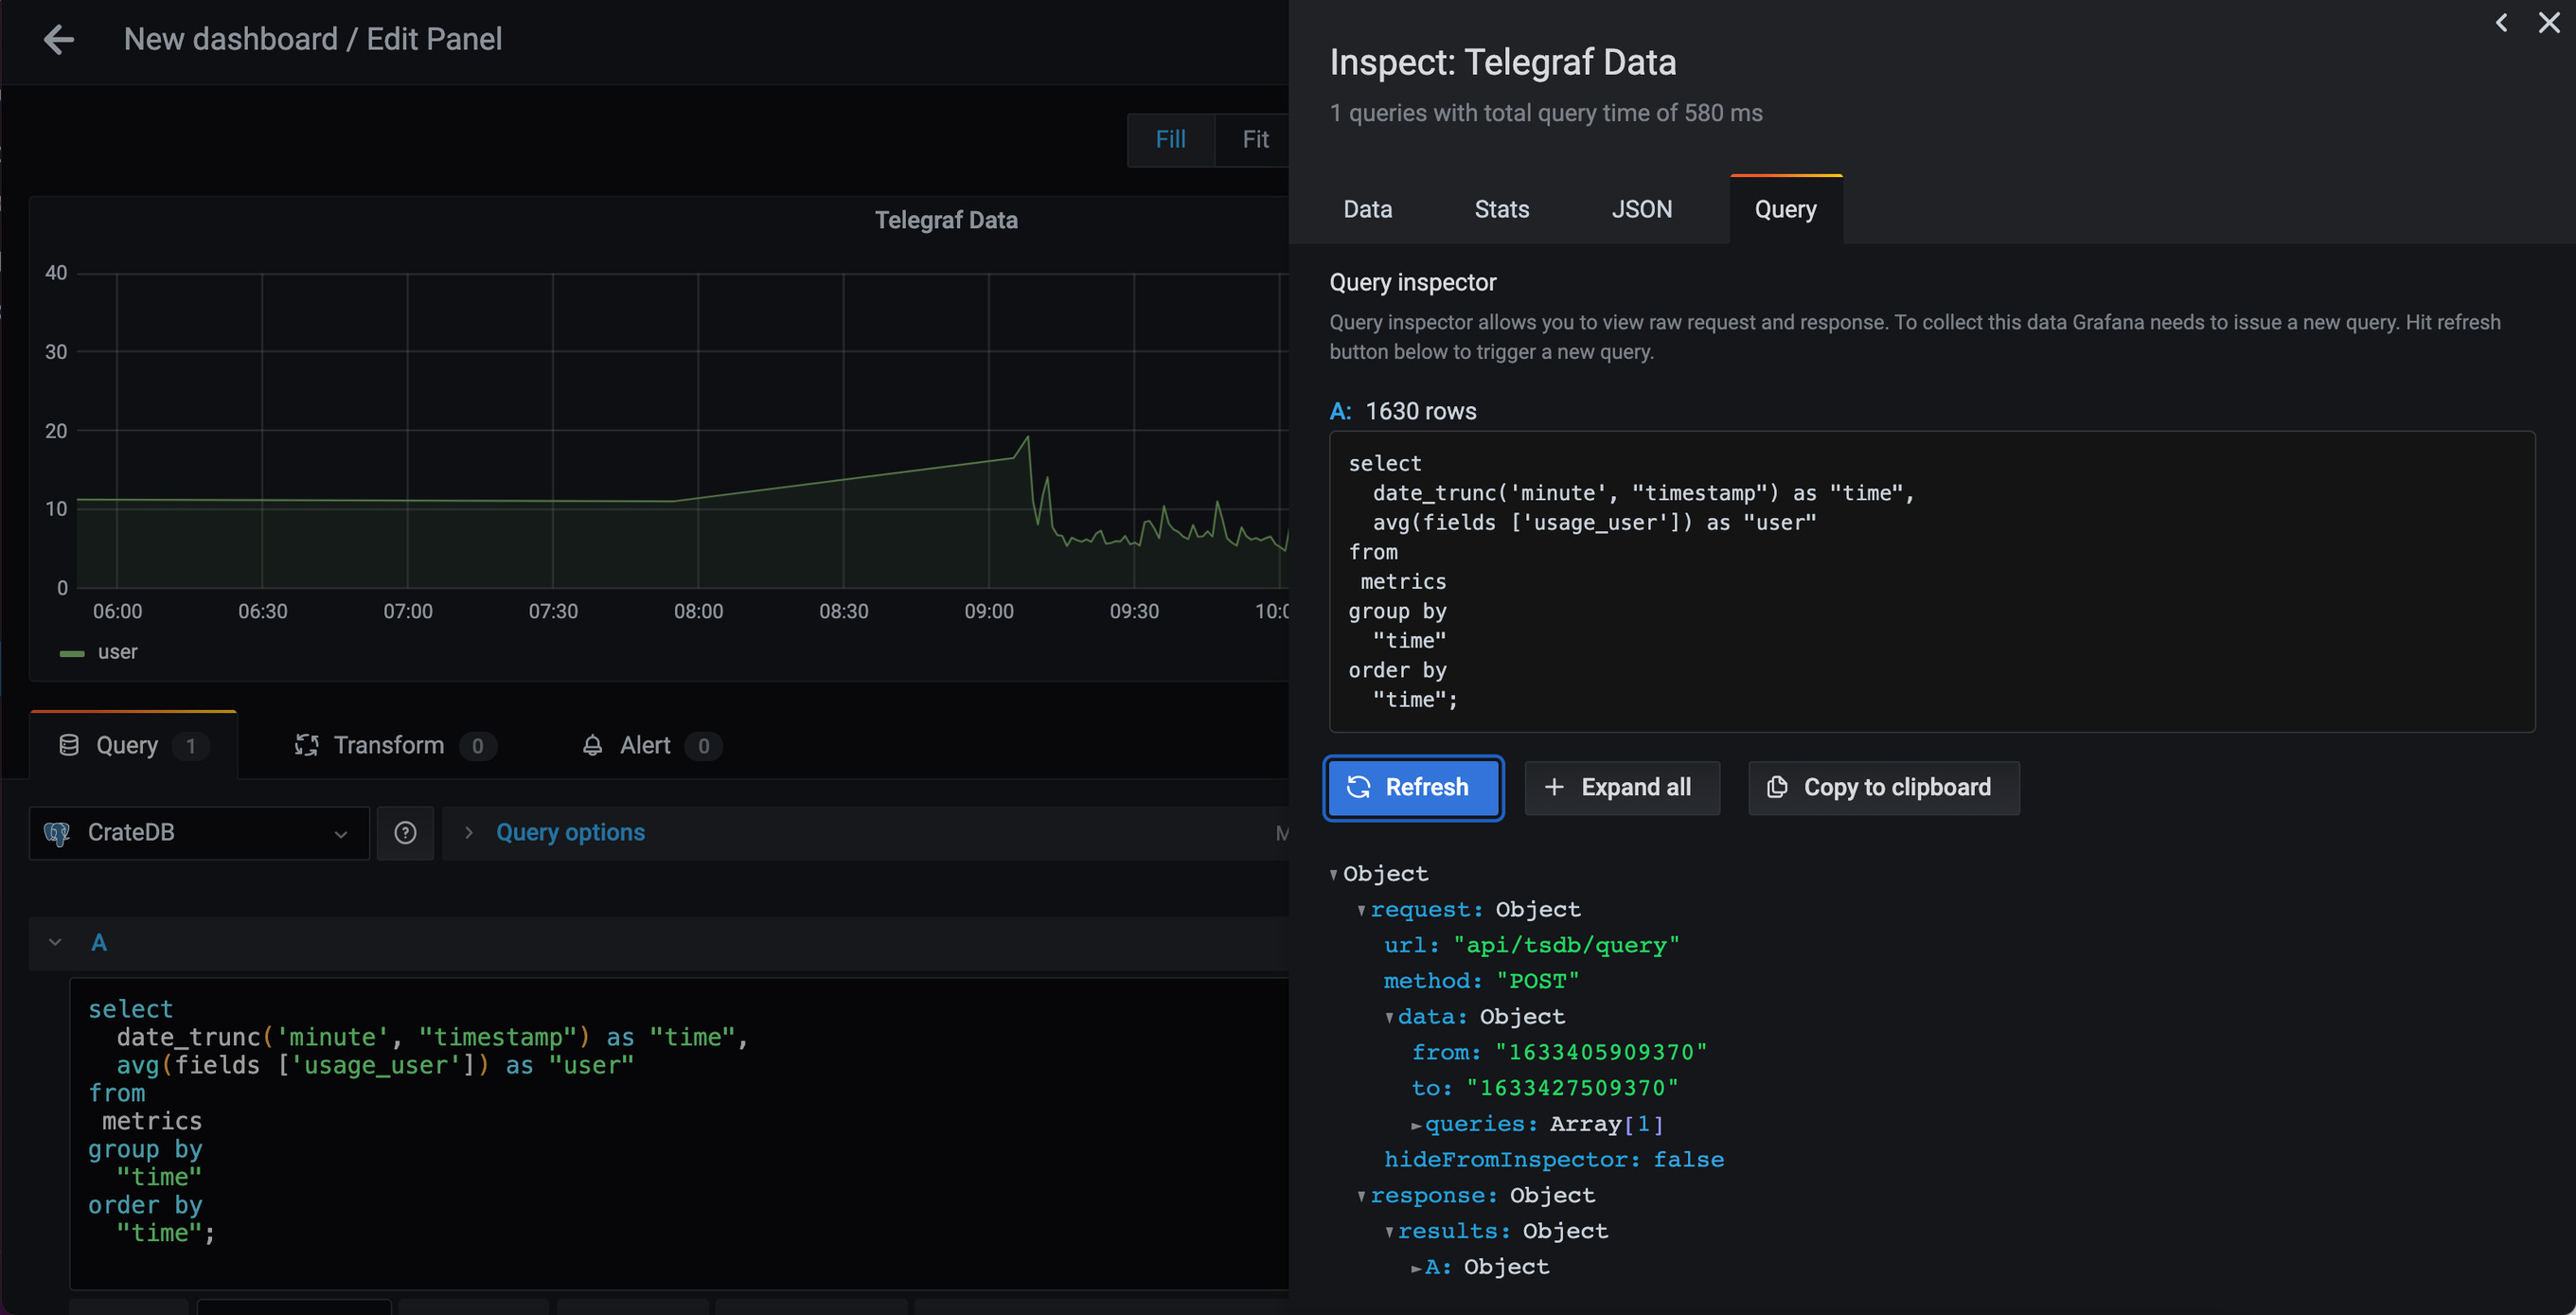
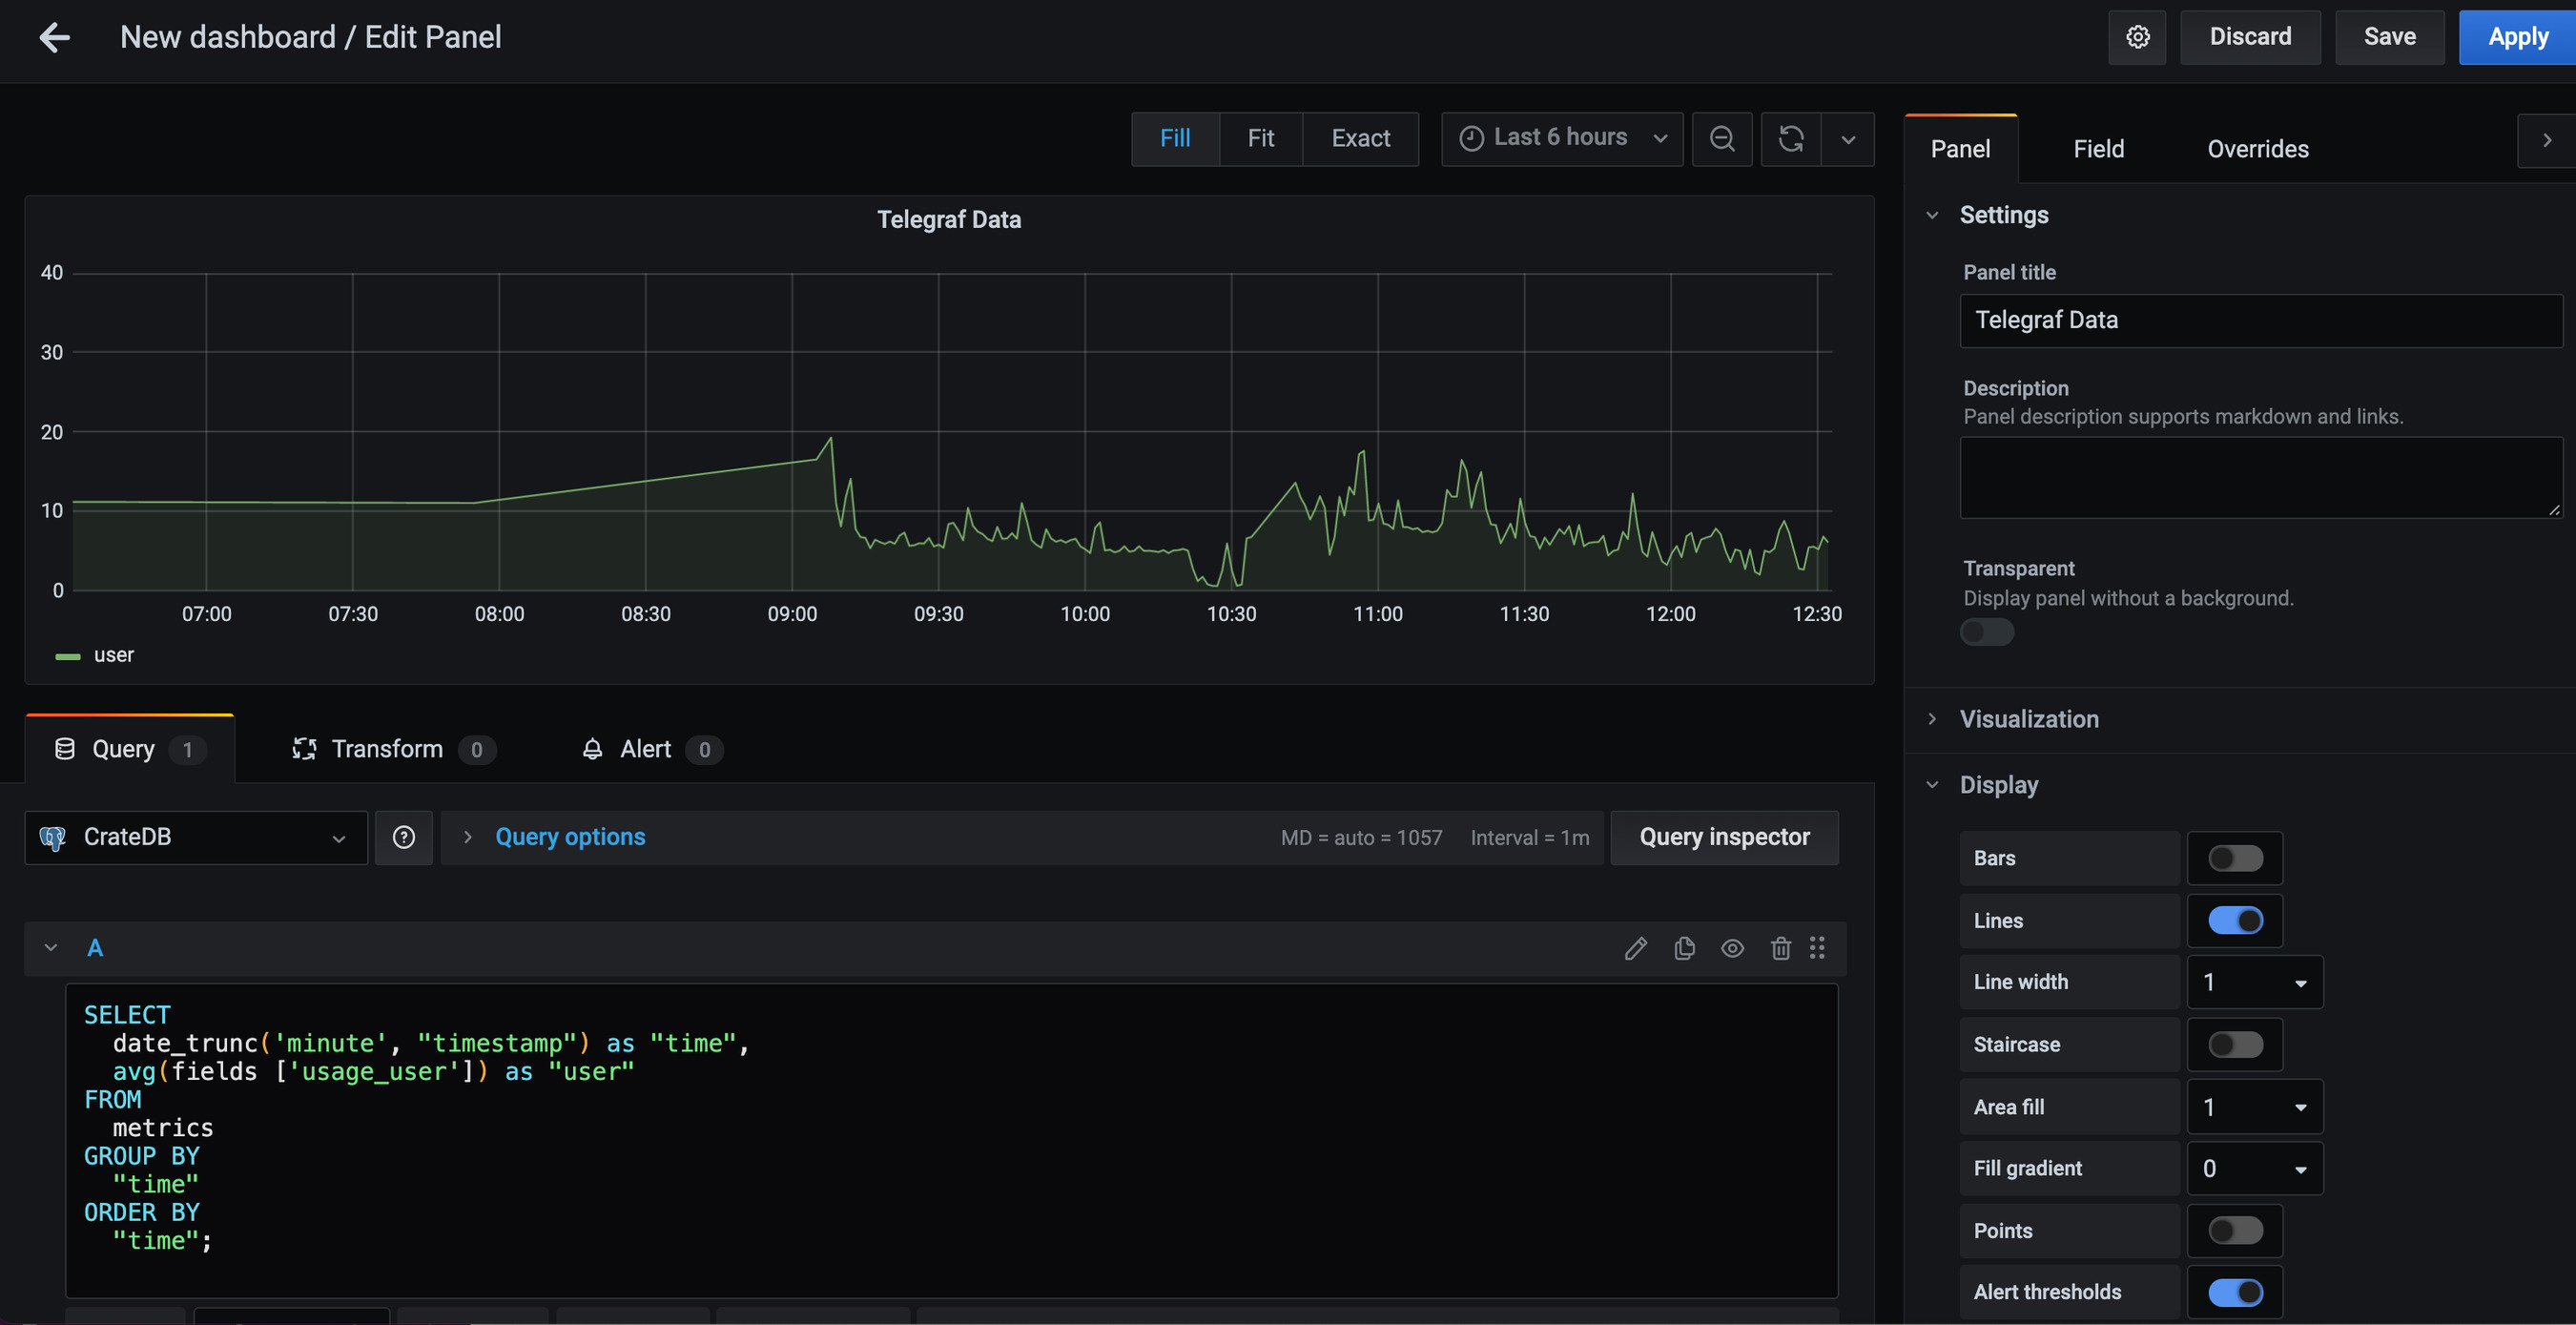
With the new query, I navigate to Query inspector again, and now it shows the results from the new query on the main graph.
Wrap Up
Telegraf can collect data from machines, third-party APIs, sensor data, among other things. From there, you can collect, process, and aggregate this data before submitting it to CrateDB. When you combine Telegraf with CrateDB, a powerful distributed SQL database, you can store and analyze large amounts of this collected data in real-time. In addition, Grafana's high compatibility with CrateDB allows easy data visualization, leading to comprehensive insights.