It’s probably not news that the Crate.io team are excited about data. It's part of the job description. And with so many of our customers’ focused on scalability and working with machine and time series data, we're especially interested in tools that help make understanding data at scale easier. So we're huge Grafana fans and are excited to announce the availability of a CrateDB Plugin for Grafana.
Grafana is an open source tool dedicated to displaying your real-time data in more digestible ways by presenting you with a beautiful, graph-rich dashboard. The CrateDB plugin for Grafana enables CrateDB SQL database clusters to act as data sources for your Grafana deployment, providing an easy way to visualize real-time analytical and time-series data with SQL.
Our team is so excited about the great work Grafana is doing that we're coming along to GrafanaCon to talk about it. Our Engineering Manager, Paul Adams will be talking about using Grafana and CrateDB for processing your machine data. He'll be bringing along a live demo to show how well CrateDB plays with one of our favorite tools. He’ll be joined by Claus and Andy to help pass out swag and share data war stories at the CrateDB booth. If you're in the New York area, tickets are still available.

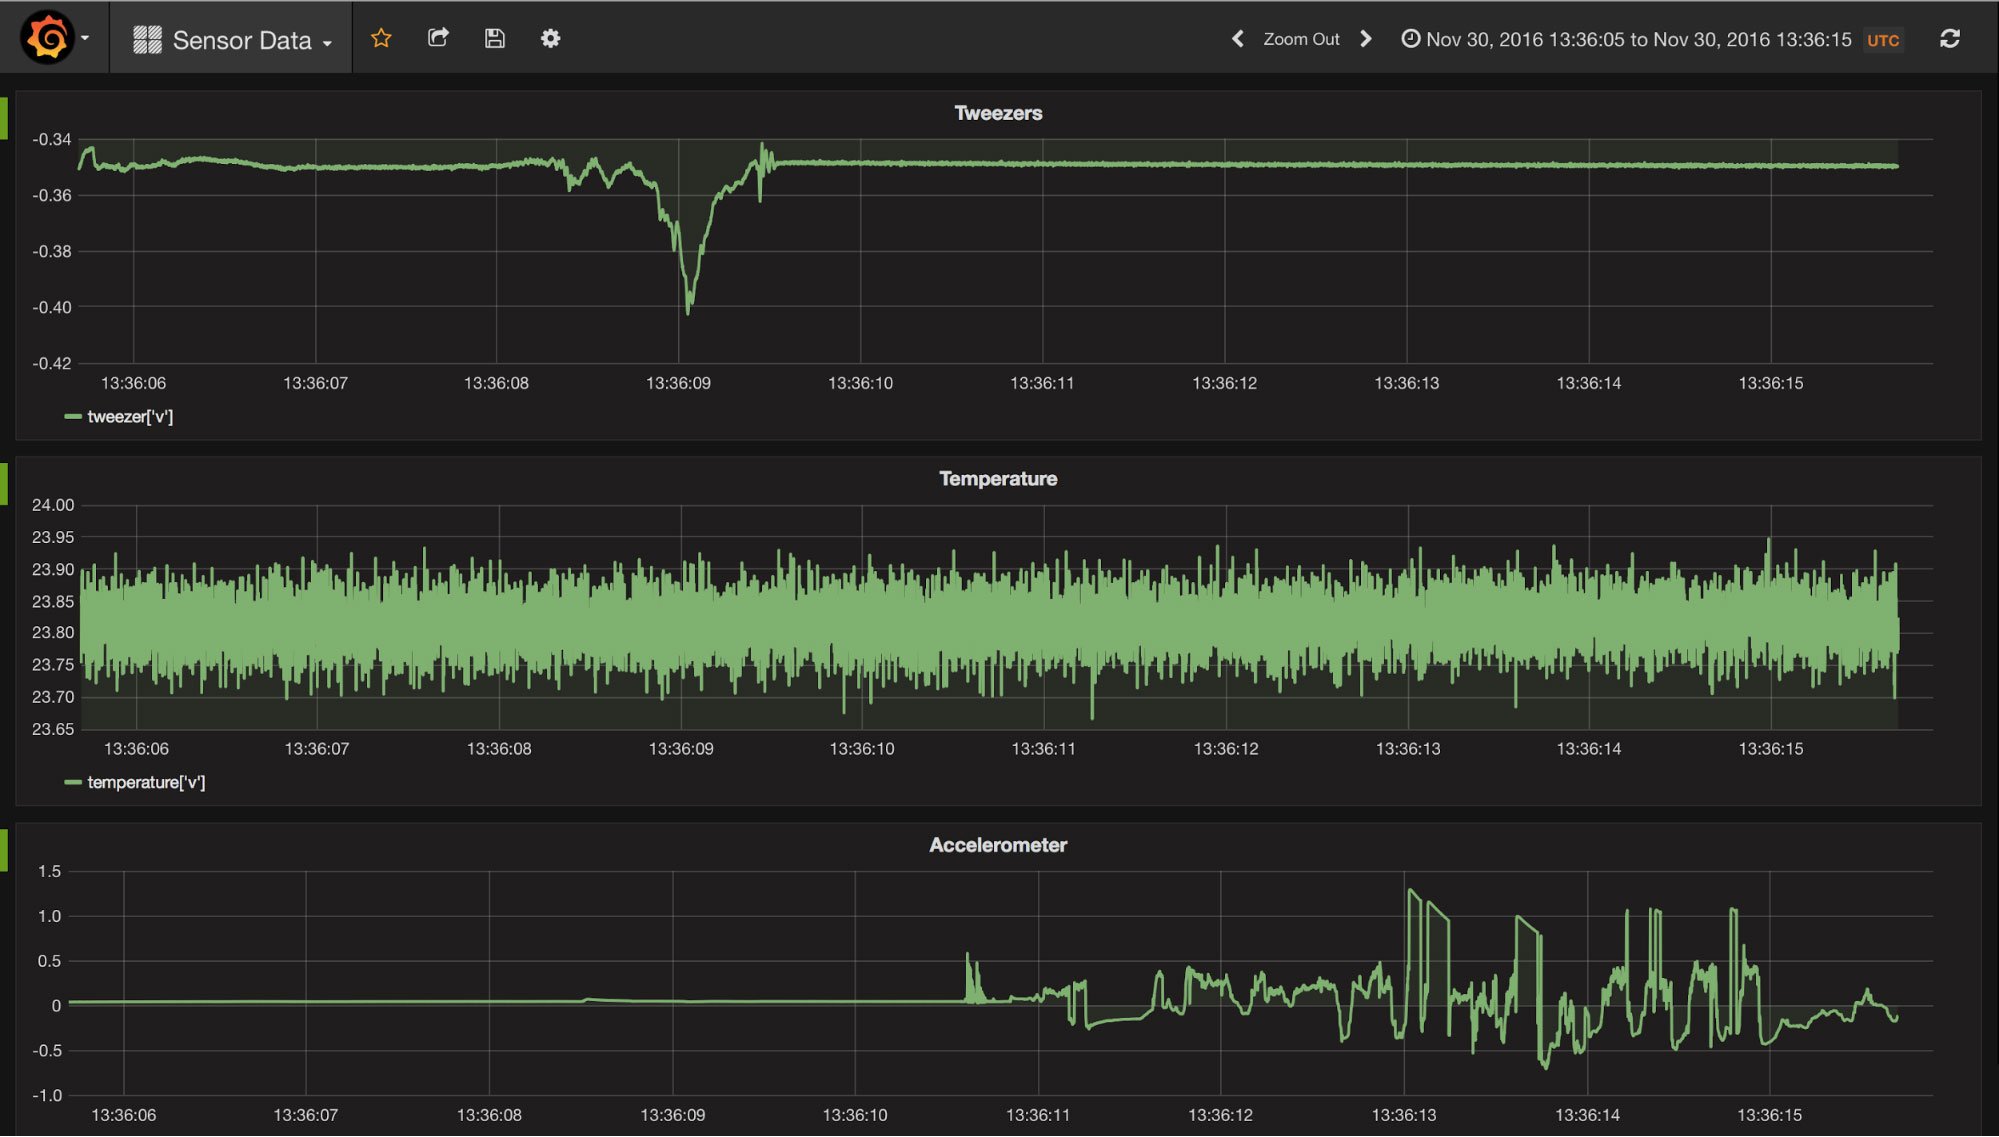
The Ganter Q.Brixx is usually found in industrial and test engineering contexts, providing the means of monitoring physical properties of production processes. Paul’s taken a Q.Brixx on the road with him to GrafanaCon with a demo that connects three sensors displaying real time voltage, resistance and temperature data. These sensors will read out data at 10khz into a CrateDB instance before connecting this new CrateDB datasource to Grafana to render beautiful real time visualizations of sensor data.
While Paul is showing off how CrateDB and Grafana work together for real time sensor data on stage, Claus and Andy will be showing off CrateDB’s scalability at our booth. They’ll be live demonstrating how CrateDB handles a data set of every yellow cab ride in NYC from 2009 to today. They love answering questions (and handing out swag!) so stop by to try to stump them.
If you can't make it to New York for the conference, then we hope that you’ll help yourself to the CrateDB - Grafana plugin. You can find more information including installation instructions for the CrateDB Grafana plugin here.
We're always looking to improve our plugins and products. If you have any feedback on the CrateDB plugin for Grafana (or if you just want to say hello!) you can find us on GitHub, StackOverflow or join us in our community Slack channel. You can also always reach us on Twitter or Facebook.