JasperReports Server is a powerful and feature-rich open source reporting and analysis server that can be used for business intelligence (BI). It enables the delivery of mission-critical information on a real-time (or scheduled) basis to the web, printer, or a variety of file formats.
CrateDB is a distributed SQL database that makes it simple to capture, store, and analyze massive amounts of machine data in real-time.
These two products go well together: JasperReports Server is a user-friendly self-serve platform that allows anyone to leverage the power of CrateDB.
In this post, I will show you how to get started on macOS, but these instructions should be trivially adaptable for Linux or Windows.
Install CrateDB
JasperReports Server makes advanced use of SQL window functions. Fortunately, CrateDB 4.0 just shipped with support for advanced window functions. So, we'll need to install 4.0 or higher to continue.
To get started, head on over to the CrateDB download page. At the time of writing, you need to select the Testing or Nightly distribution to get 4.0 or higher.
Download the tar.gz file.
Once downloaded, unpack the tarball and change into the resulting directory:
$ tar -xzf crate-*.tar.gz
$ cd crate-*
There is no need to build anything. However, we do need to make one small configuration change.
JasperSoft Server bundles a PostgreSQL server for its own use defaults to using port 5432. CrateDB offers PostgreSQL wire protocol compatibility that also defaults to using port 5432.
If we want to install both products on the same machine (for testing purposes), we must reconfigure one of these port numbers.
Let's reconfigure CrateDB.
Open the config/crate.yml file.
Find this line:
#psql.port: 5432Change it to this:
psql.port: 5433Save the file.
Now CrateDB will listen on port 5433 for PostgreSQL wire protocol connections.
With that done, start CrateDB:
$ bin/cratedb
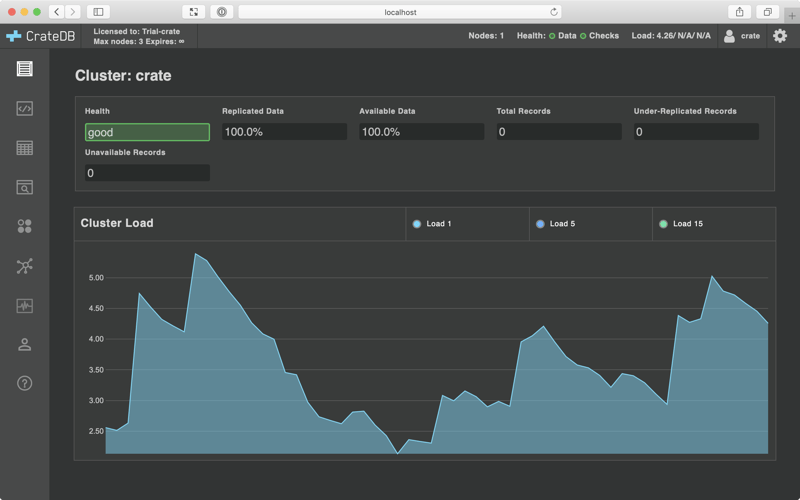
Then, open the Admin UI by visiting http://localhost:4200/ in your browser.
You should see something like this:
Load some test data
Next, we need some test data to work with.
Here's a Python script that will generate some for you and load it into CrateDB:
Let me show you how to run this script.
First, set up a new directory:
$ mkdir test-data
$ cd test-data
Then, download the script:
$ curl https://gitlab.com/snippets/1870650/raw -o load.pyThis script has some dependencies, but to avoid installing Python packages in a way that affects the rest of your system, we'll set up a Python 3 virtual environment:
$ python3 -m venv venvThen, install the dependencies, like so:
$ venv/bin/pip install Faker crateNow, run the script:
$ venv/bin/python3 load.pyThis will take a few seconds as it generates the test data and loads it into CrateDB.
Once it's done, navigate to the Tables Browser in the Admin UI by selecting the Tables icon from the left-hand navigation menu.
You should see a screen like this:
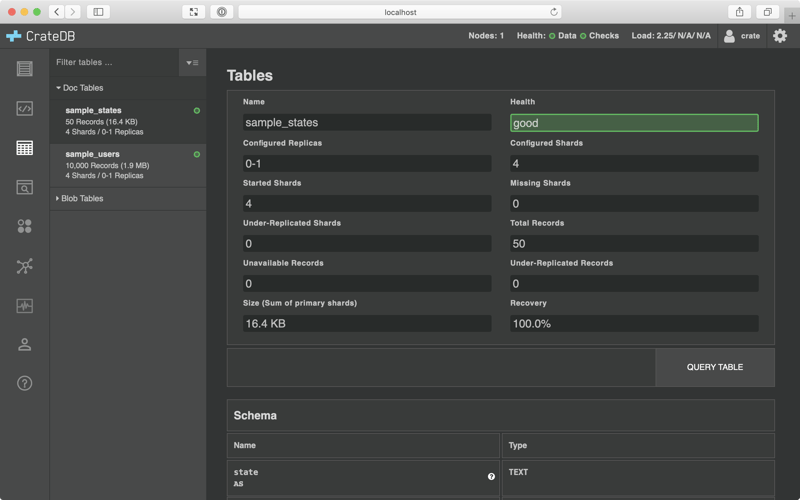
Brilliant! That means everything worked. We have a sample_states and a sample_users table, both populated with data.
If you're curious, you can select QUERY TABLE to browse the records of either table.
Install JasperReports Server
Go to the Jaspersoft download page.
From there, select the TRY FREE FOR 30 DAYS button in the Enterprise column. (You will need to fill out a contact form to continue.)
On the next screen, first, select your operating system. Then select the DOWNLOAD X64 button in the JasperReports Server row.
Your download should begin.
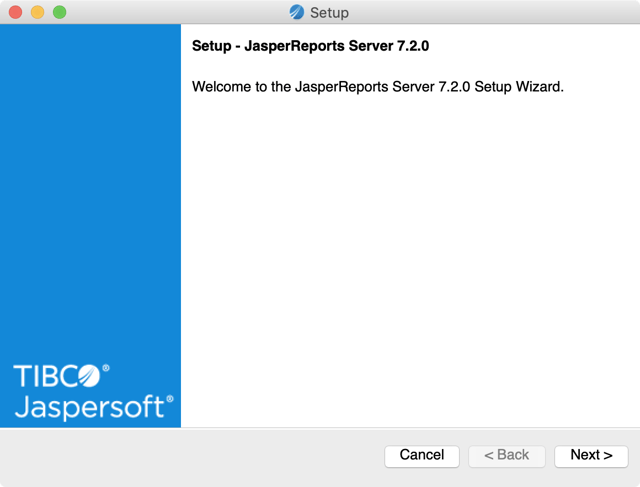
Once the download is complete, open the archive and launch the installer. (On macOS, you will need to Control-click the installer to get an Open option on the security warning about the app developer being unidentified.)
You should see this:
Follow the installer instructions and go with the defaults.
Finally, you should see a screen like this:
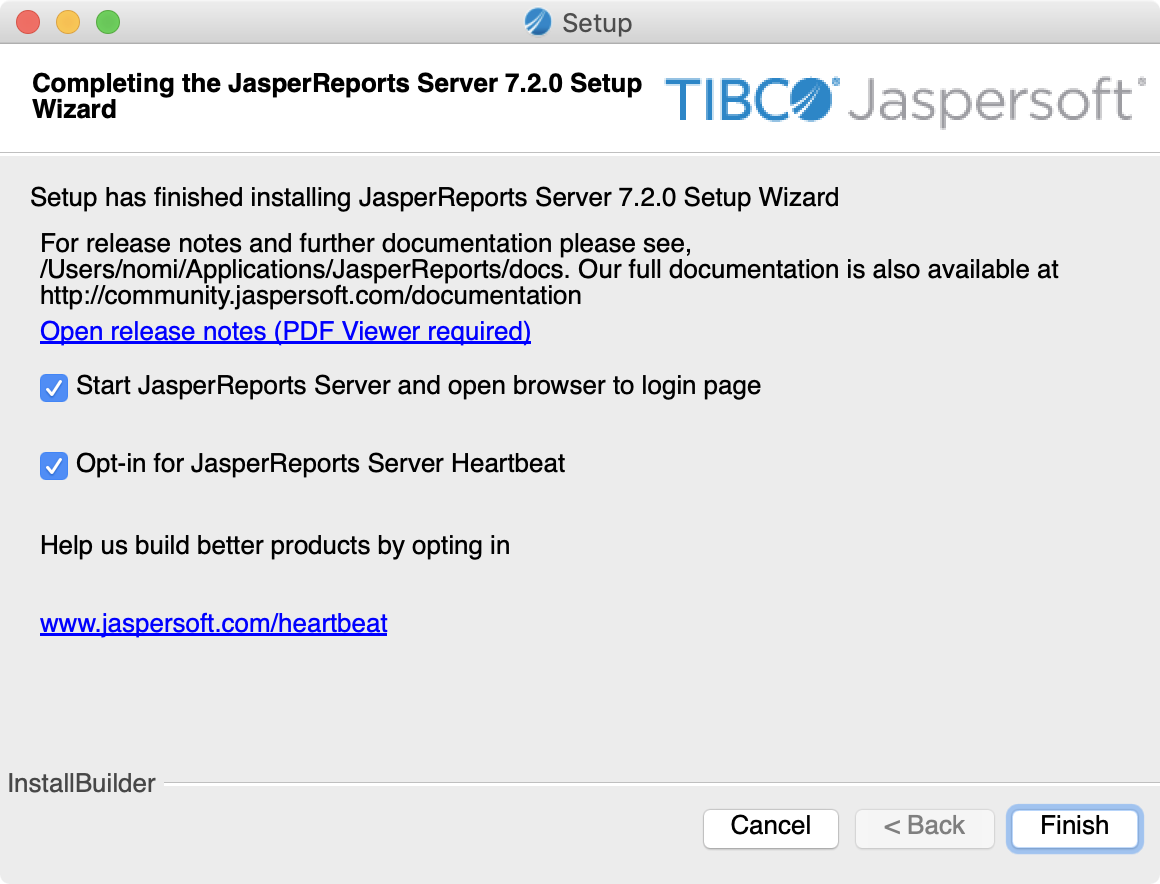
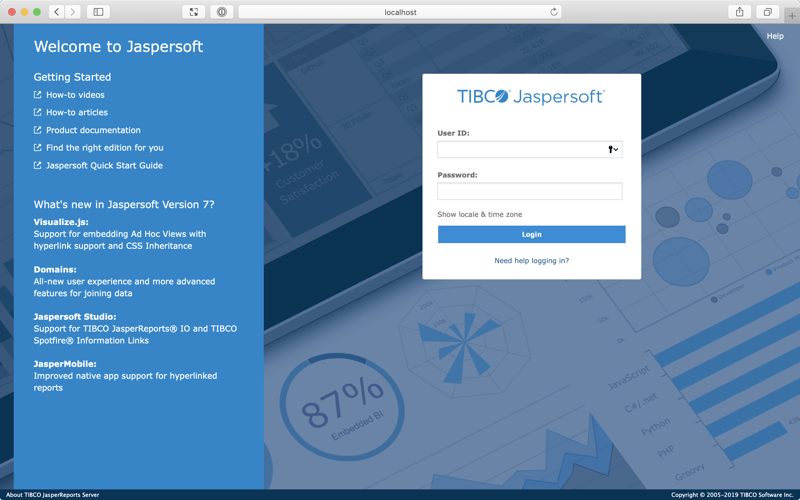
Leave the top-most checkbox selected. When you select Finish, the installer will start JasperReports Server and open http://localhost:8080/jasperserver-pro/login.html in your browser.
Before you login, we need to make a quick configuration change.
Change into the install directory. For me, that was:
$ cd /Applications/jasperreports-server-7.2.0
Then, open the apache-tomcat/webapps/jasperserver-pro/WEB-INF/adhoc-ehcache.xml file.
Find these lines (near the top):
<ehcache name="adhocCache"  maxBytesLocalHeap="400M"
         maxBytesLocalDisk="2G">
And change them to this:
<ehcache name="adhocCache"  maxBytesLocalHeap="1"
         maxBytesLocalDisk="2G">
By setting the heap size to 1 byte, we effectively disable the ad hoc query cache. This is useful while we're testing because the ad hoc query cache sits between the reports we want to test and the data in CrateDB.
Save the file.
Then, restart the server:
$ ./ctlscript.sh restart
In case you need to, you can use this script to do other things:
$ ./ctlscript.sh

usage: ./ctlscript.sh help
       ./ctlscript.sh (start|stop|restart|status)
       ./ctlscript.sh (start|stop|restart|status) postgresql
       ./ctlscript.sh (start|stop|restart|status) tomcat

help       - this screen
start      - start the service(s)
stop       - stop  the service(s)
restart    - restart or start the service(s)
status     - show the status of the service(s)
Configure JasperSoft Server
Before you continue, go back to the JasperSoft Server login page. Refresh the page, to make sure that the server restart didn't break anything.
Then, log in with:
- Username:
jasperadmin - Password:
jasperadmin
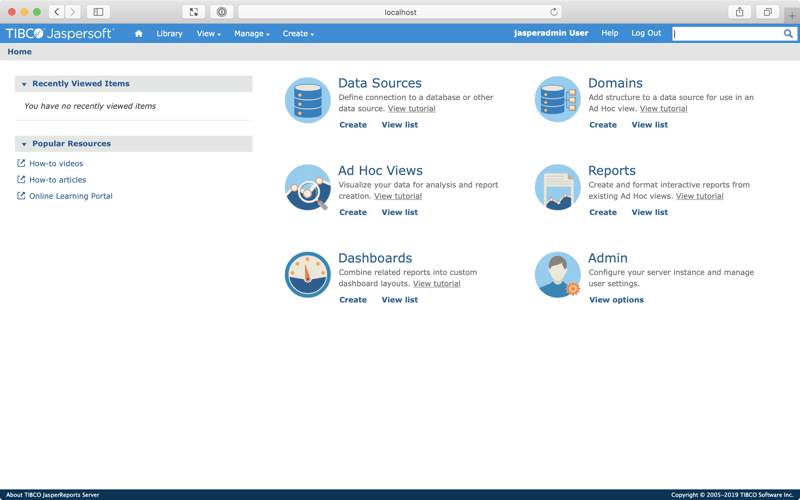
You should be greeted with the home screen:
Create a new data source
To connect to CrateDB, we must create a new data source.
From the home screen, select Create under Data Sources.
You should be presented with this screen:
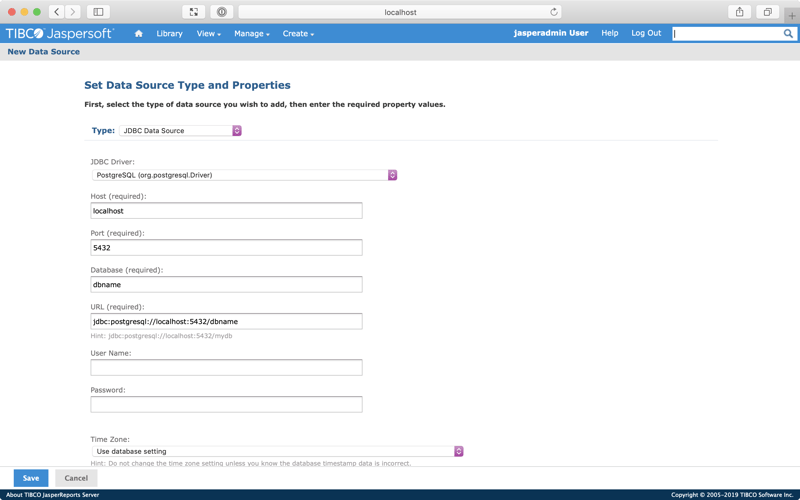
Change the Database from dbname to doc (the default CrateDB schema). As you do this, the URL field should automatically update itself.
We need to correct that URL, however. Select the 5432 port number, and change it to 5433 to match what we configured earlier.
For User Name, specify crate.
Then, select Test Connection.
If everything worked, you should see something like this:
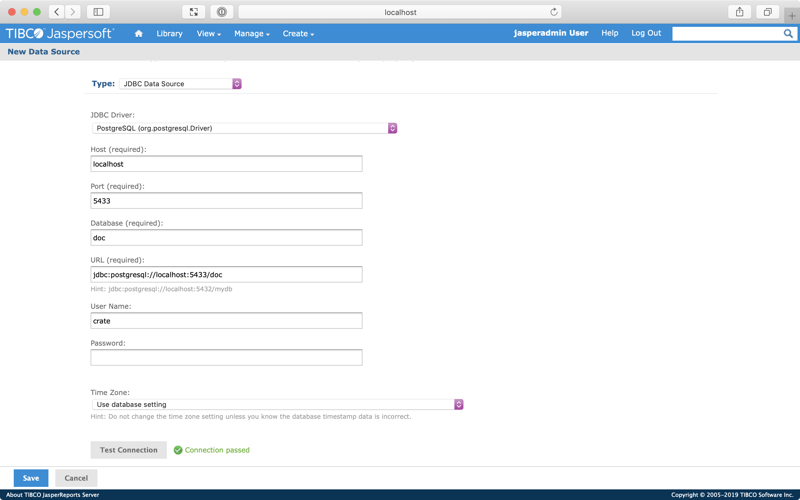
Select Save. A modal popup should appear.
Name the data source "CrateDB". Resource ID should auto-populate as CrateDB. And leave the Data Sources folder selected.
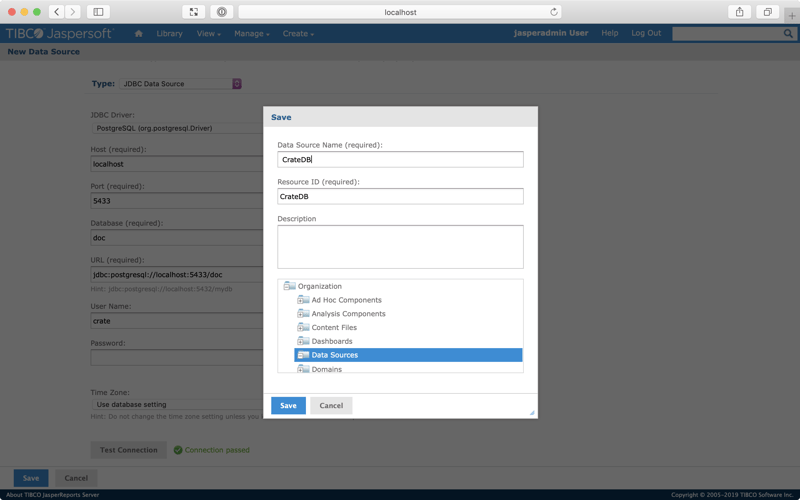
Select Save again.
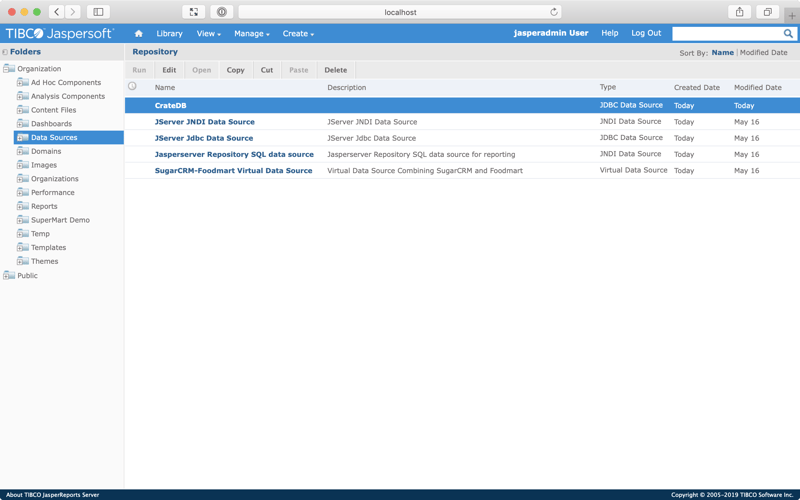
On the next screen (the Repository screen), you can use the left-hand folder tree navigation to find your newly created data source:
Create a domain
Now CrateDB is set up as a data source, we have to create a suitable domain.
A domain is basically just a view on your data. Domains are used to prepare your backend data for end-users.
From the top navigation menu, select Create → Domain.
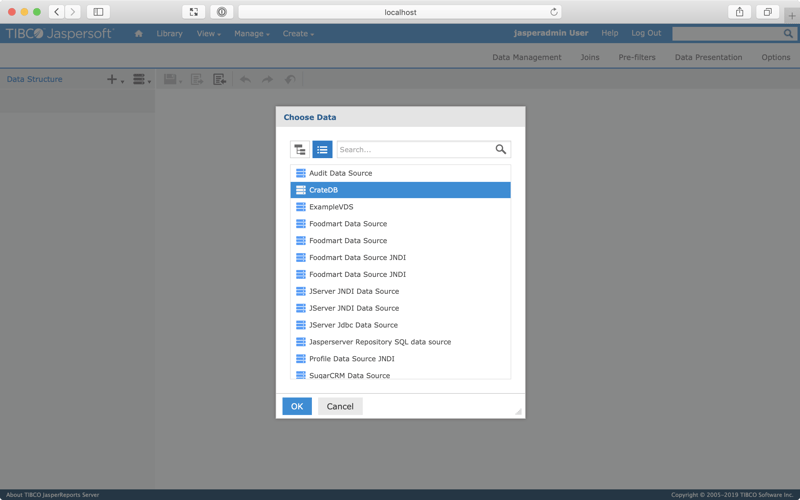
Select CrateDB. Then OK.
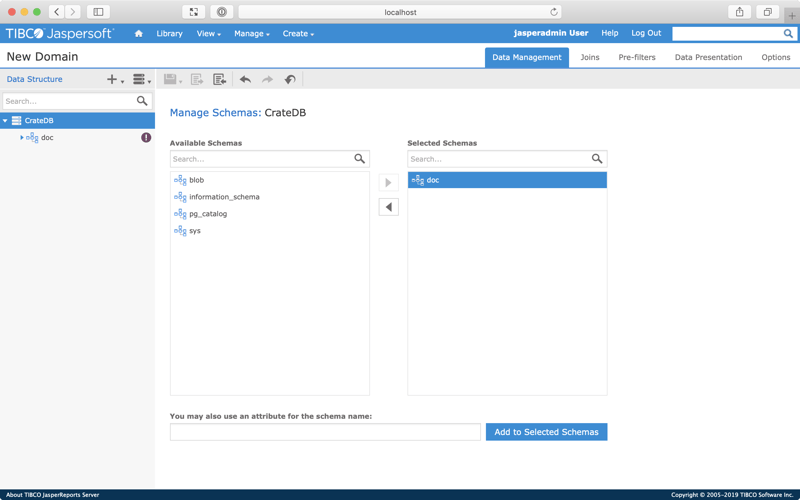
You should see this:
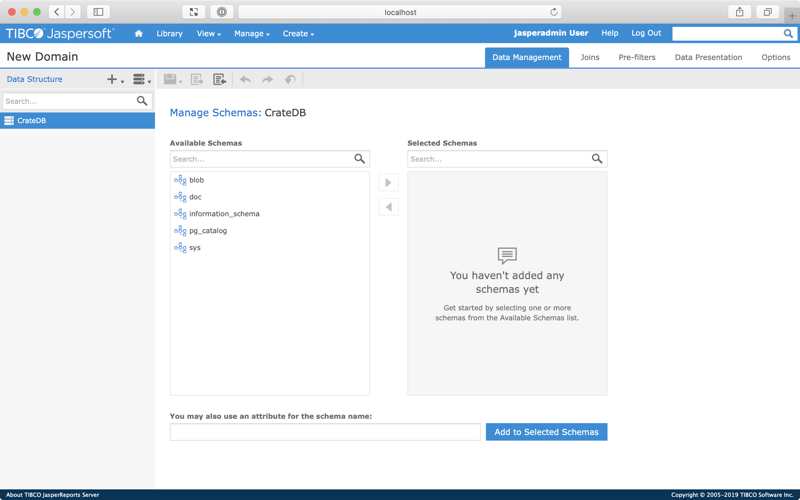
Select the doc schema and then select the right arrow to move it from the Available Schemas list to the Selected Schemas list. (Alternatively, you can drag and drop the schema.)
Now, select the doc schema from the left-hand tree menu.
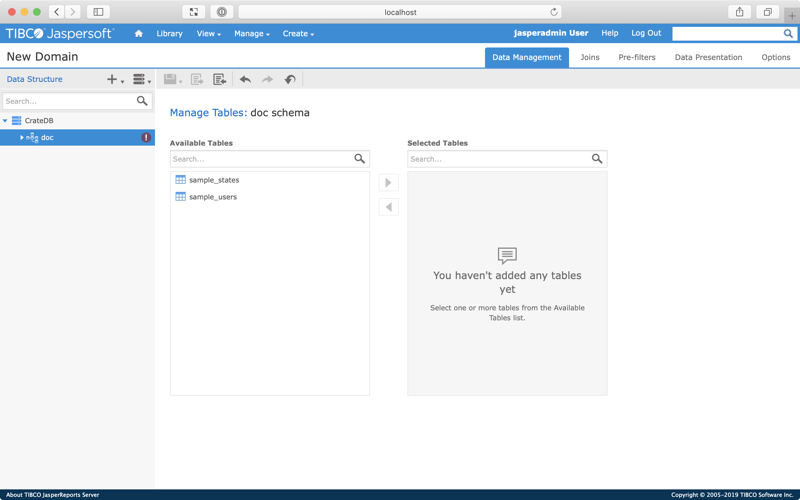
Move both tables (sample_states and sample_users) from the Available Tables list to the Selected Tables list.
Next, select Joins from the top right-hand sub-navigation menu.
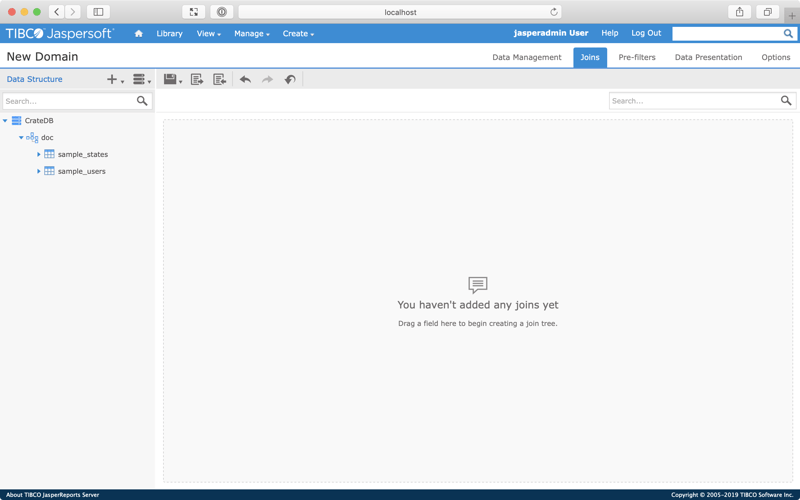
Expand the tables in the left-hand tree menu to reveal a list of column names. From here, drag and drop the state column from the sample_states table to the empty workspace in the middle of the screen.
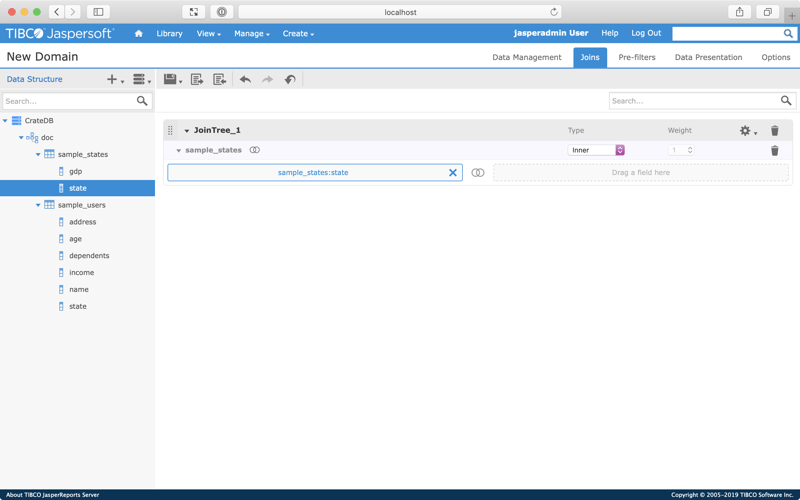
Then, drag and drop the state column from the sample_users table to the box marked "Drag a field here" on the right-hand side of the workspace.
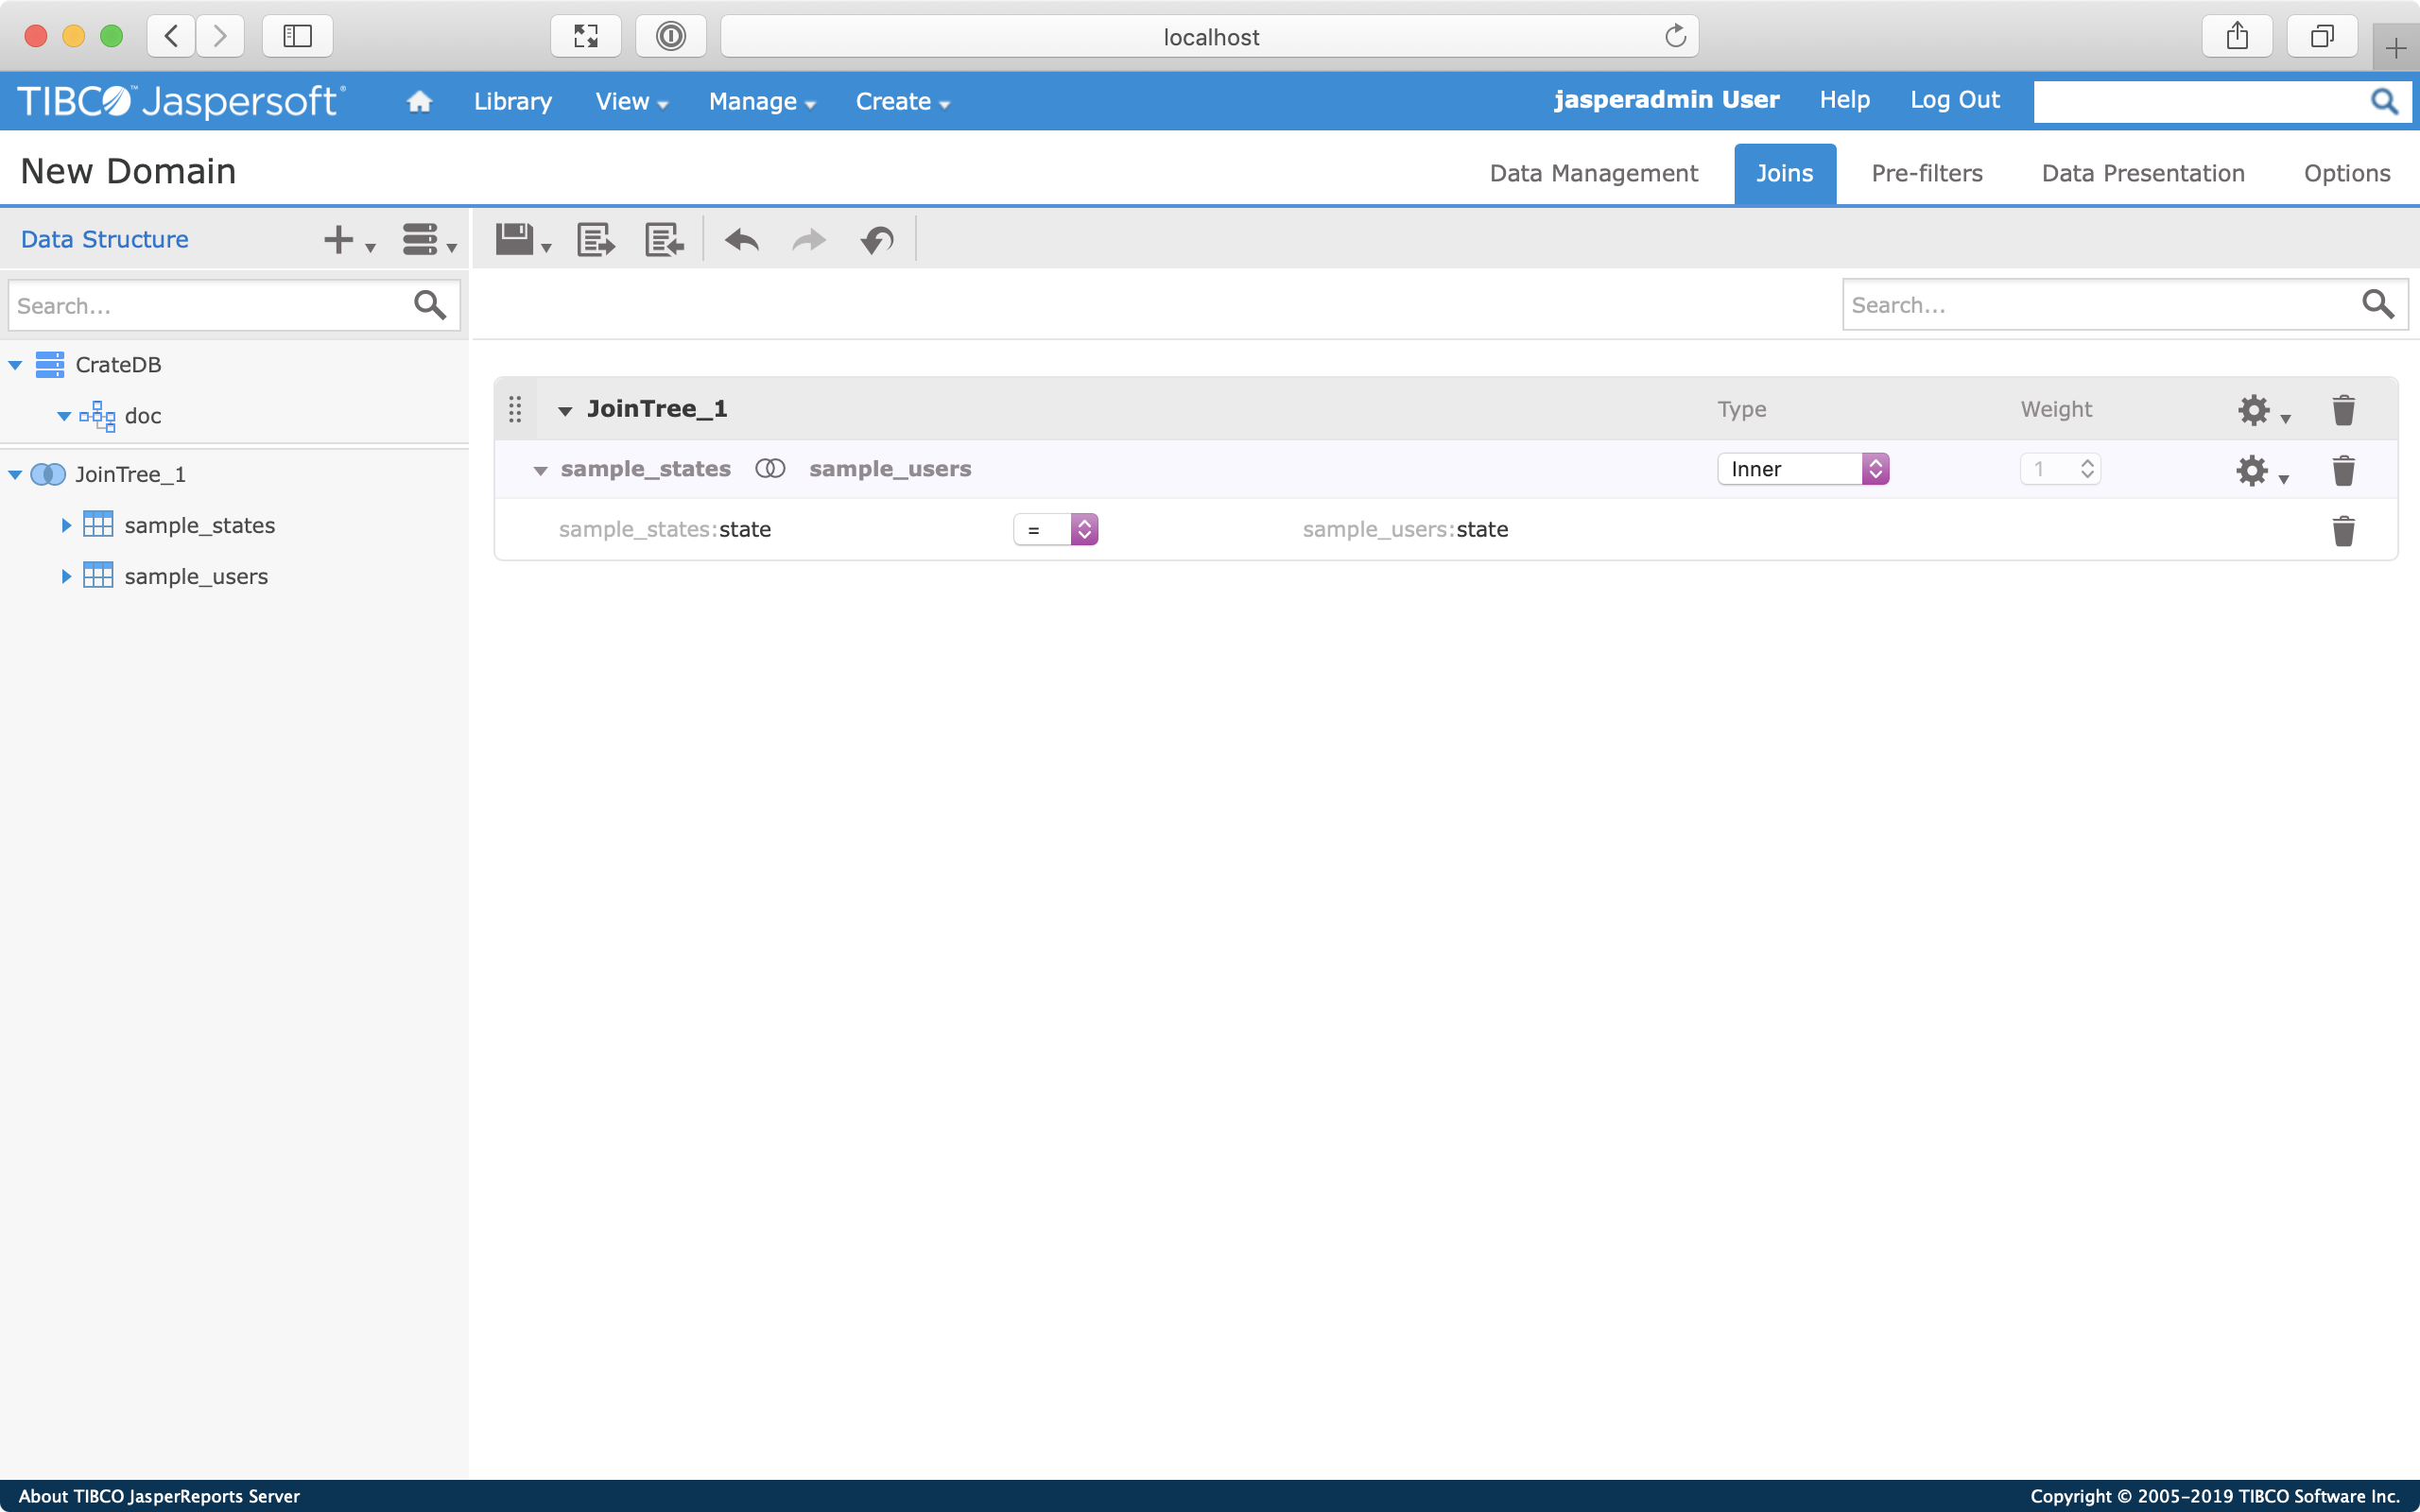
Great! We've just configured an inner join on both tables using both state columns as a key.
Now, select Data Presentation from the top right-hand sub-navigation menu.
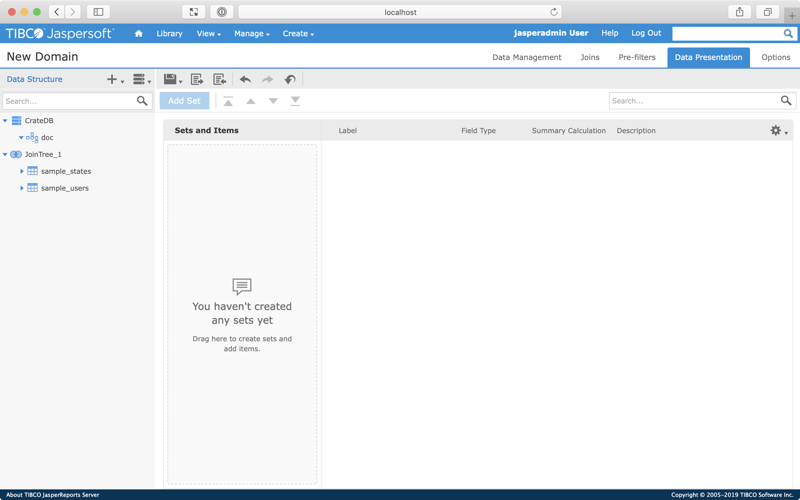
From here, we have to select which columns to include. You can do this by dragging and dropping columns from the left-hand tree menu.
Here's how I set mine up:
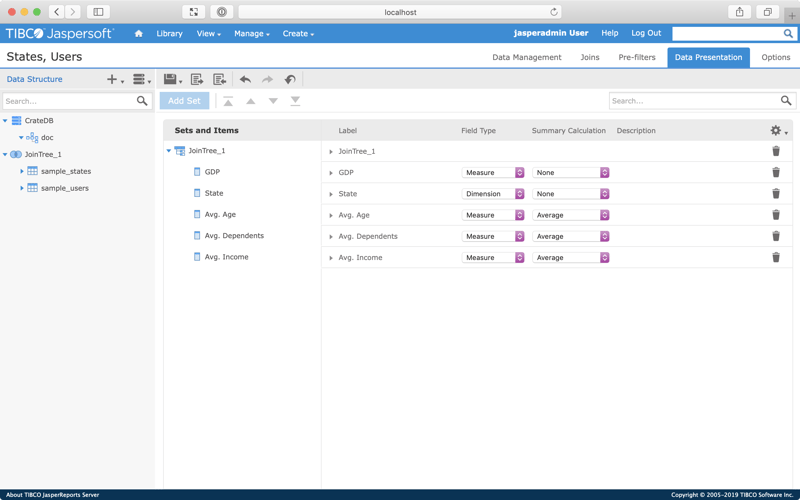
Notice that I have configured a few columns to display an average Summary Calculation. Also, I selected the pencil icon next to the column names in the Label column and edited them to prepend "Avg.". (I switched the labels to title case too.)
When you're happy, select the floppy disk icon from the top sub-navigation menu, then Save Domain.
Call the domain something like "States, Users", and save it in the Domains folder.
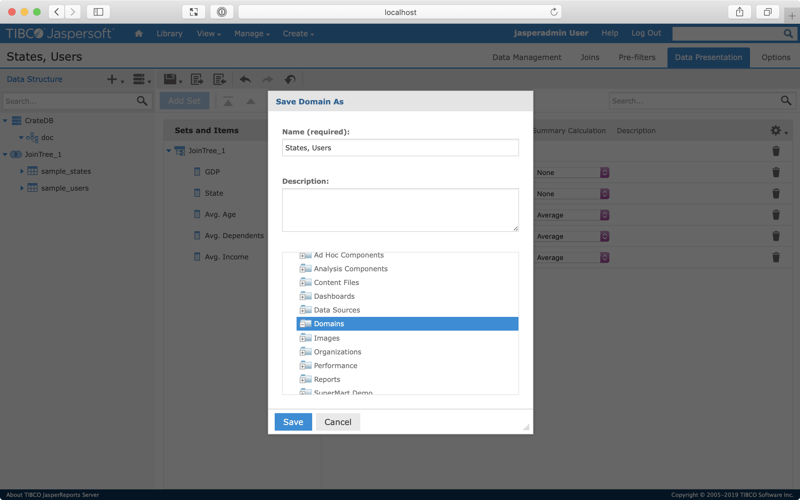
Select Save.
Create an ad hoc view
Now we have our domain set up, we must create an ad hoc view, which is basically just a prepared query we want to run against the domain.
From the top navigation menu, select Create → Ad Hoc View.
In the modal popup window that appears, you can use the text input to search for the domain you created. (Or you can just scroll down the list of demo domains.)
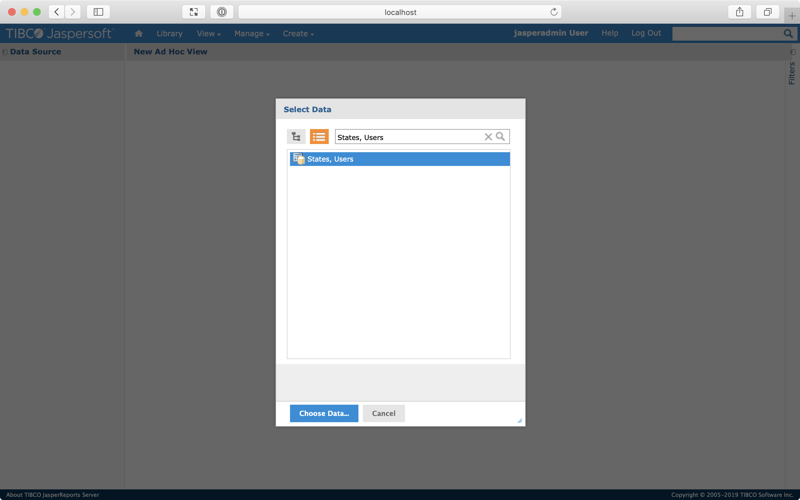
Select Choose Data...
You should be presented with a screen like this:
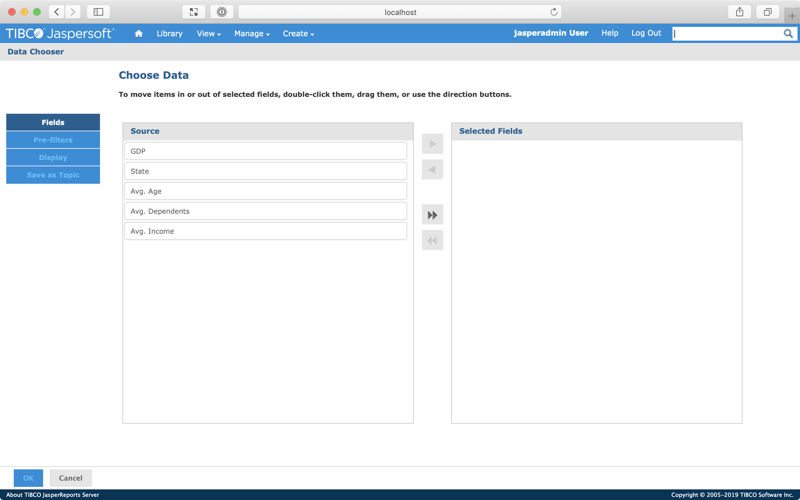
Select the double arrow icon to move all of the columns from the Source list across to the Selected Fields list.
Select OK.
You should see something like this:
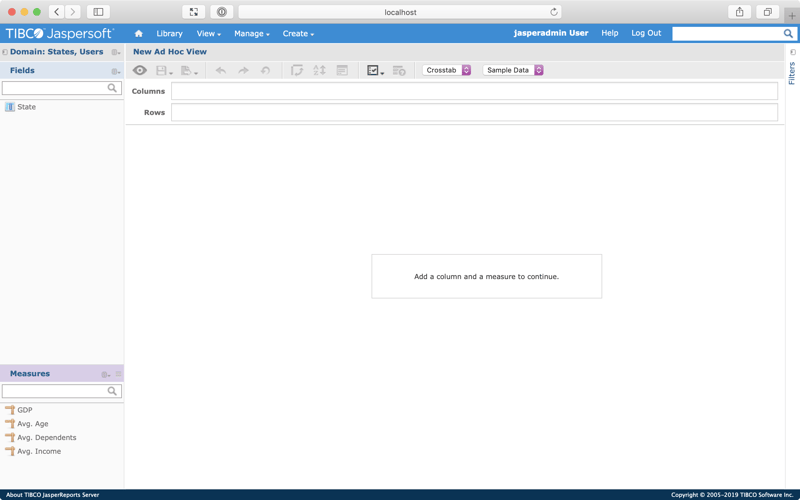
Notice that the left-hand menu is separated into two:
- Fields
- Measures
This corresponds to the classification we chose when setting up the view.
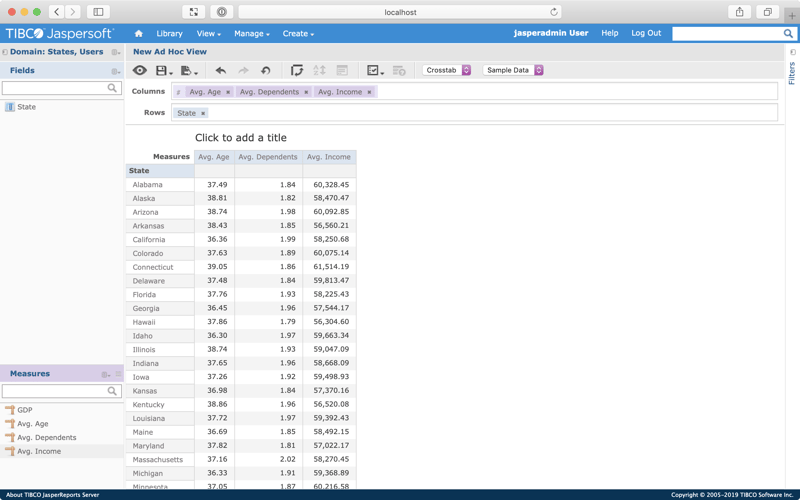
For this ad hoc view, let's report the average age, dependants, and income per state.
To group by state, drag State from the Fields menu to the Rows input.
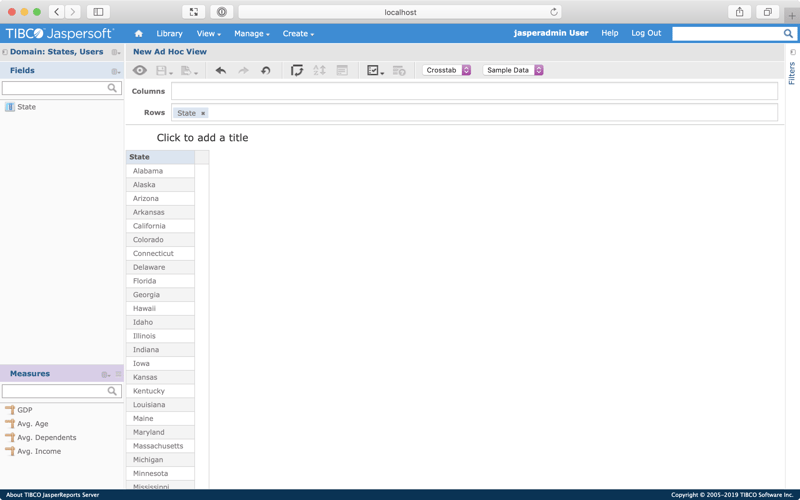
Here, you can see that the query is generating one row per state. All that's needed now is to add some columns.
One by one, drag the following items from the Measures menu to the Columns input:
- Avg. Age
- Avg. Dependents
- Avg. Income
When you're done, you should see something like this:
Select the floppy disk icon from the top sub-navigation menu, then select Save Ad Hoc View.
Choose a suitable name for the ad hoc view, such as "Aggregate State Statistics". File it under Ad Hoc Components. Then, select Save.
Congratulations, you just created your first ad hoc view.
From here, you might want to explore creating a custom dashboard from many different ad hoc views. Alternatively, head on over to the main Jaspersoft documentation center and start poking around.
Wrap Up
JasperReports Server is a self-service reporting and analytics tool. And CrateDB is a distributed SQL database. Together, they provide a powerful end-to-end platform for real-time business intelligence.
In this post, I showed you how to:
- Get CrateDB up-and-running on your local machine
- Generate some test data
- Connect JasperReports Server to CrateDB
- Create your first ad hoc view
Questions? Looking for help? Get in touch!