Note: we have published an updated version of this blogpost, using Grafana 7.4.3 and CrateDB 4.4.1. Read it here.
In case you didn’t know, Grafana is an open platform for time series data visualization and monitoring that works well for time series analytics.
And CrateDB is a distributed SQL database that makes it simple to store and analyze massive amounts of machine data in real-time.
It’s a match made in heaven.
In this post, I will show you how to get started on macOS, but these instructions should be trivially adaptable for Linux or Windows.
Install CrateDB
If you don’t already have CrateDB running locally, it’s relatively effortless to get set up.
Run this command:
$ bash -c "$(curl -L https://try.crate.io/)"
This command just downloads CrateDB and runs it from the tarball. If you'd like to actually install CrateDB a bit more permanently, or you are using Windows, check out our collection of super easy one-step install guides.
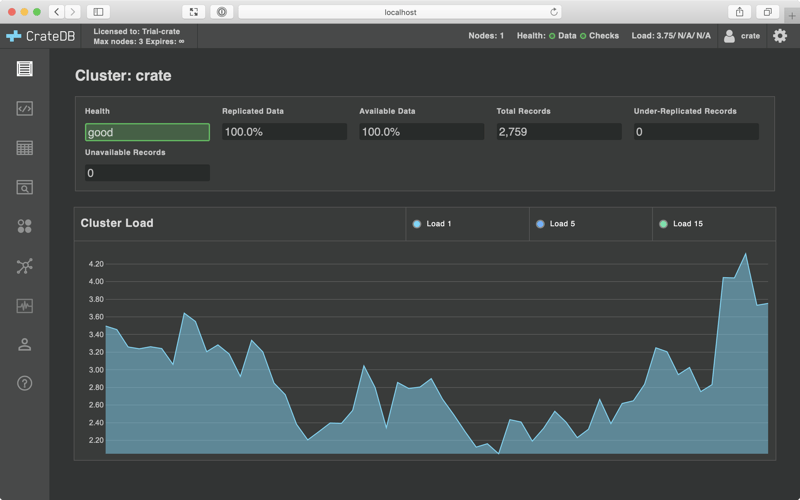
If you're using the command above, it should pop open the CrateDB Admin UI for you automatically once it has finished. Otherwise, head over to http://localhost:4200/ in your browser.
You should see something like this:
Get some data
If you’re playing around with a fresh CrateDB install, it's likely that you don't have any data. So head on over to the Help screen by selecting the question mark icon on the left-hand navigation menu.
The help screen looks like this:
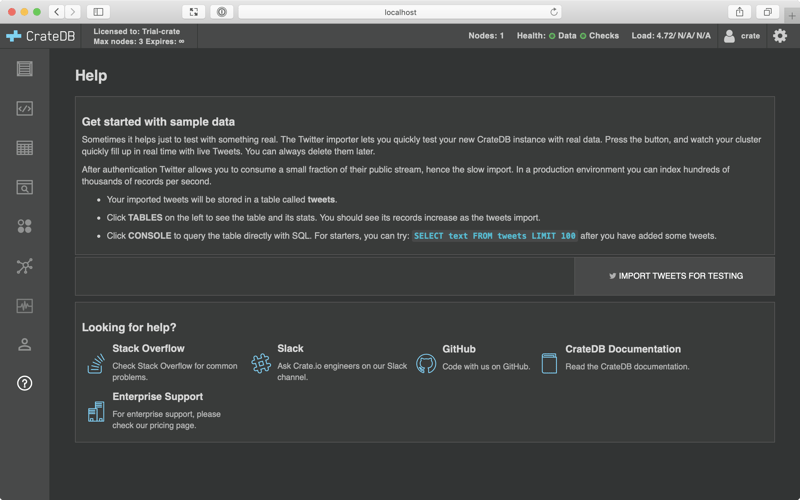
Select IMPORT TWEETS FOR TESTING and follow the instructions to authenticate your Twitter account.
Don’t worry. This isn’t going to post anything on your behalf. It doesn’t even look at your tweets. All this does is import a bunch of recent public tweets on Twitter.
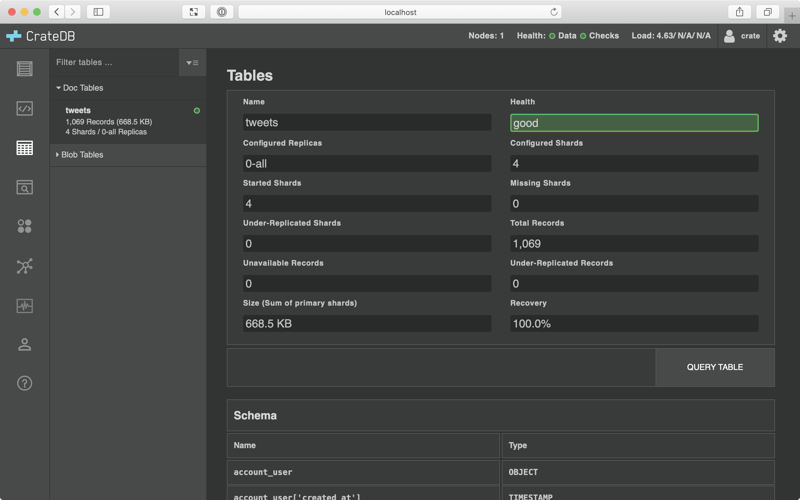
Once you're done, select the Tables icon from the left-hand navigation, and then select the tweets table. You should end up here:
http://localhost:4200/#/tables/doc/tweets
Which should look like this:
Get Grafana running
Head on over to the Grafana download page. Select the operating system you're using and follow the instructions.
The current version of Grafana was 6.1.6 at the time of writing. You may have to adapt these instructions if you are running a newer version.
I'm using macOS with Homebrew installed, so I ran these commands:
$ brew update
$ brew install grafana
Then, to start Grafana up, I ran:
$ brew services start grafana
If you do the same, you should see something like this:
==> Successfully started `grafana` (label: homebrew.mxcl.grafana)
Now, you can access the Grafana interface by visiting http://localhost:3000/ in your browser.
You should see something like this:
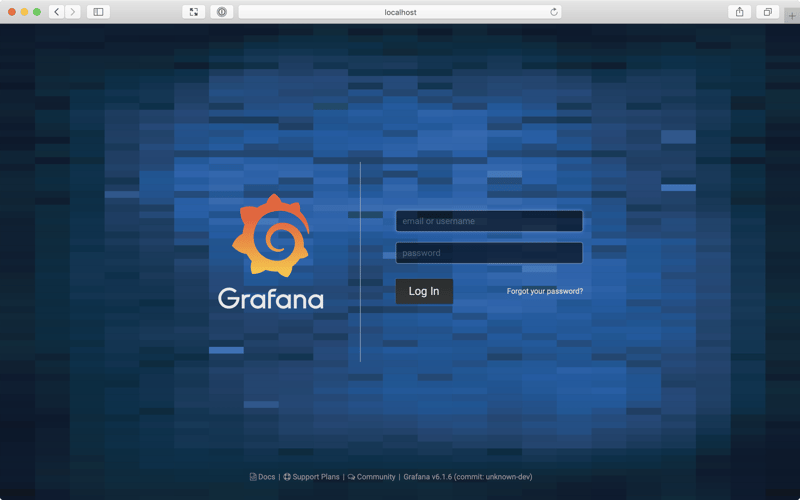
The default username admin and the default password is admin. Enter those on this screen. After doing so, you will be prompted to change your password.
Once logged in, you should see your Grafana home dashboard:
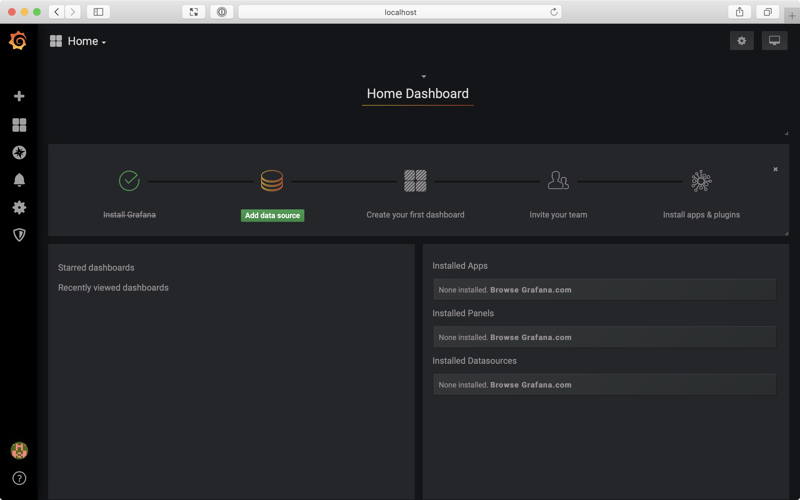
Add a data source
From the Grafana home dashboard, select Add data source.
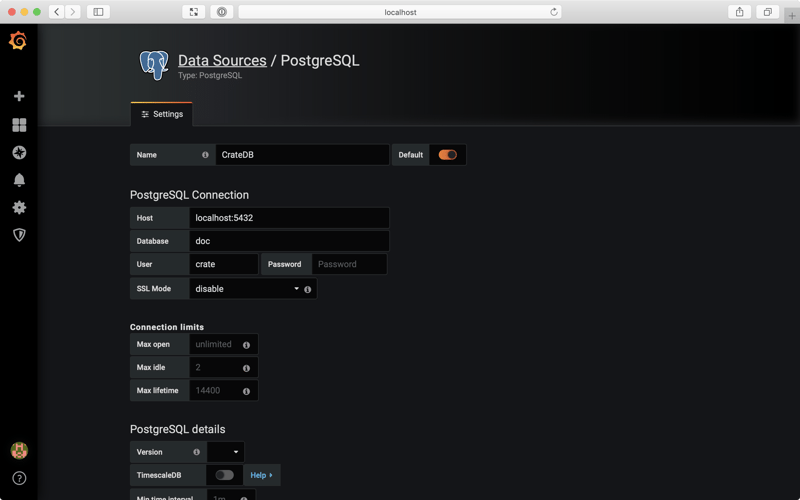
Select the PostgreSQL data source, and then:
- Set the Name
CrateDB - Set the Host to
localhost:5432 - Set the Database to
doc - Set the User to
crate - Set SSL Mode to
disable
When you're done it should look like this:
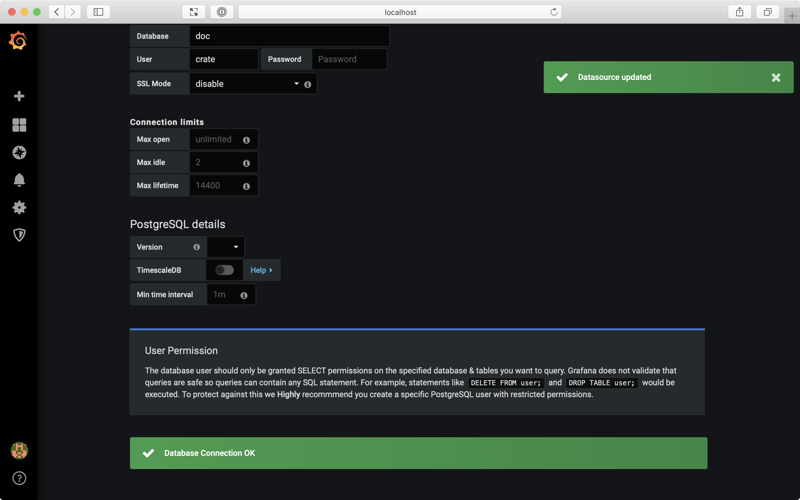
Scroll down and select Save & Test.
You should see this:
Set up a new dashboard
Go back to your Grafana home dashboard.
You should be invited to set up a new dashboard:
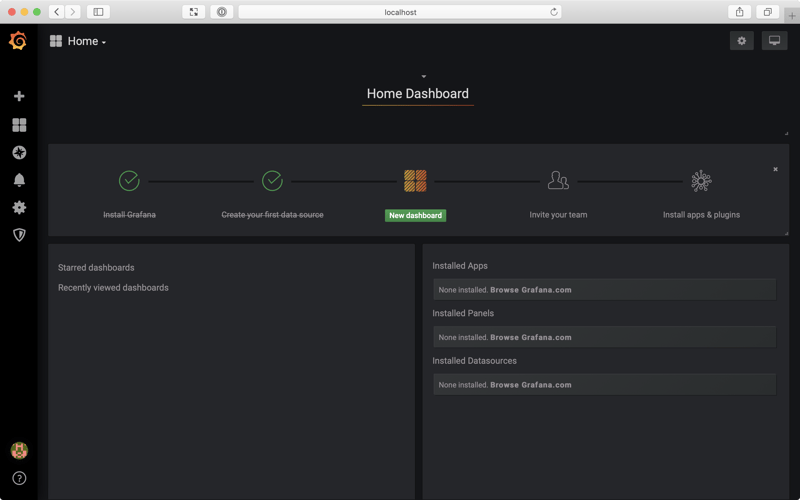
Select New dashboard.
The next screen should look like this:
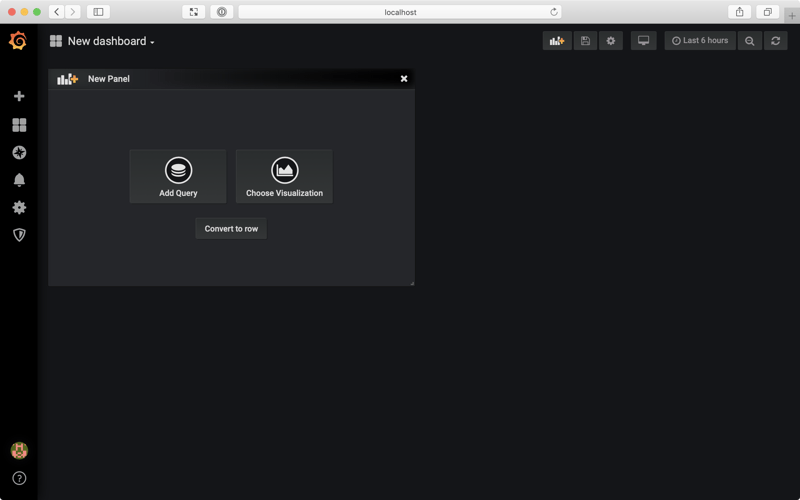
We have some imported tweets. So let’s work with that and graph the number of imported tweets over time.
Select Add Query, and you should see this:
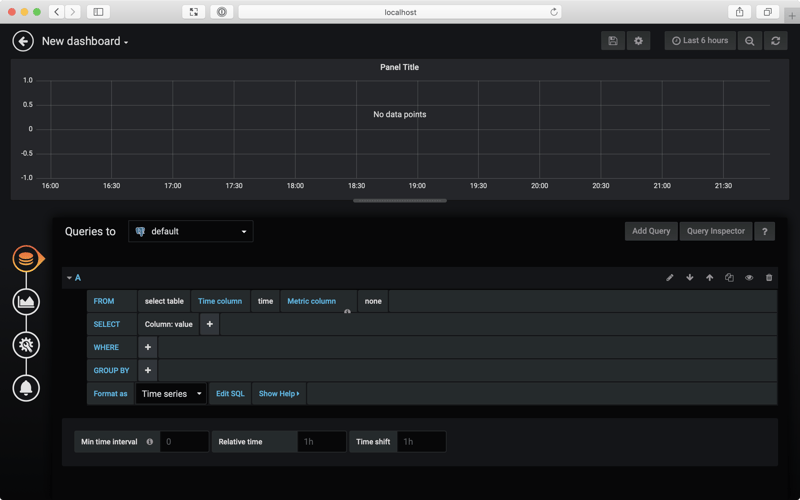
Use the query editor at the bottom of the screen, and do the following:
- On the FROM line, change
select tabletotweets. Then, changetimetocreated_at. - On the SELECT line, change the Column
valuetoid. Thgen, select + and choose Aggregate Functions → Count. Finally, change the Aliasidtotweets.
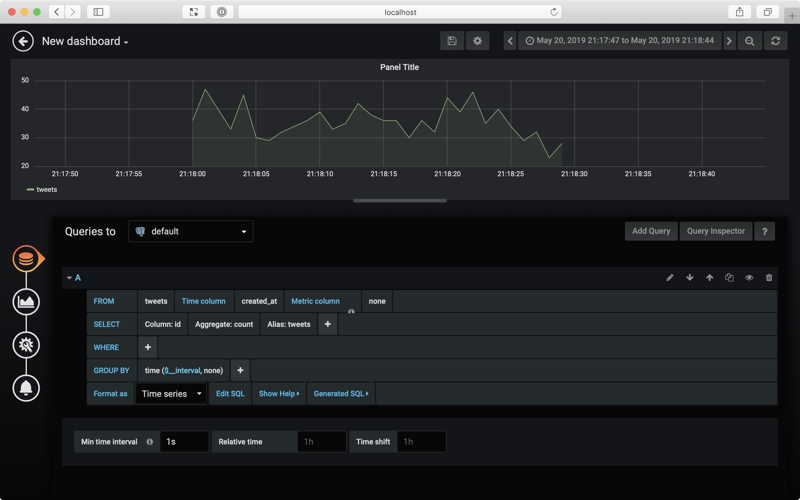
At this point, the graph above the query editor should be displaying some data. Here's what my screen looked like:
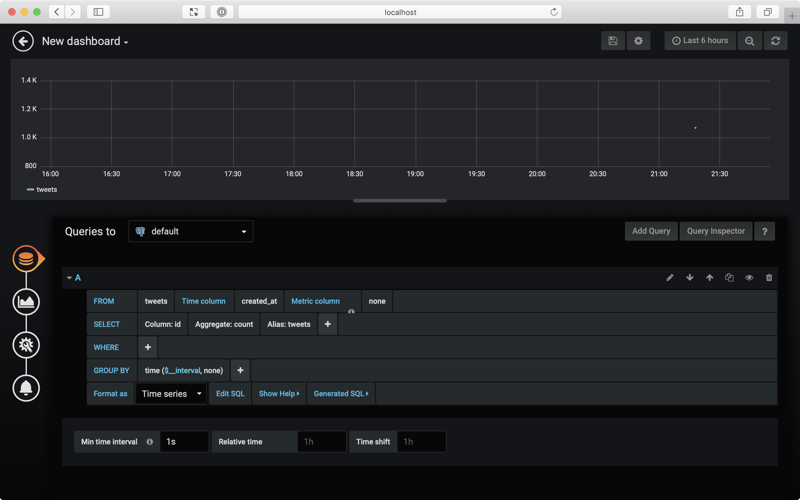
The query we’ve configured counts the number of tweets imported per time interval. Here, we what looks like a single data point, on the far right-hand side of the graph. This data point corresponds to the short burst of tweets we imported.
Also, notice that Grafana has set GROUP BY to time ($__interval, none). This is needed for the aggregate function we’re using.
Zoom in
That little data point isn’t exciting by itself. But fortunately, Grafana lets us configure the graphed time range and the aggregation time interval.
The first thing to do is set the Min time interval (bottom left) to 1s. This means that Grafana will graph the total number of imported tweets per second, instead of per minute, which is the default.
Now, move your pointer over the chart and select a time range that includes the data point of interest. The chart should zoom in:
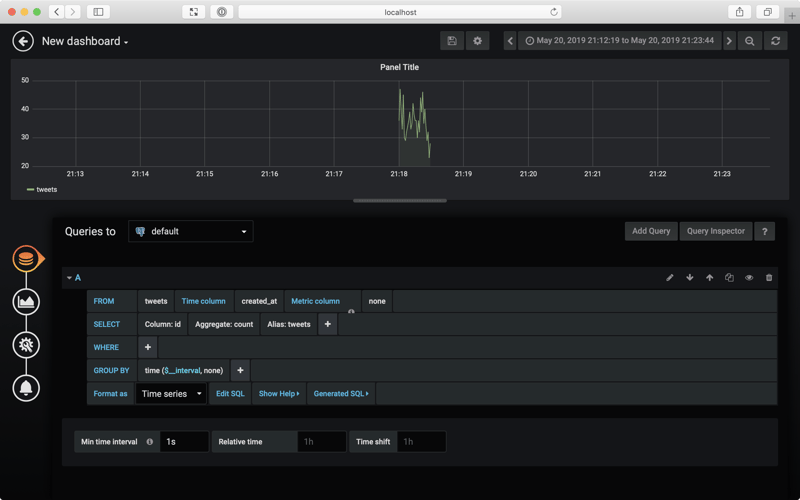
Select another area of the chart to zoom in some more:
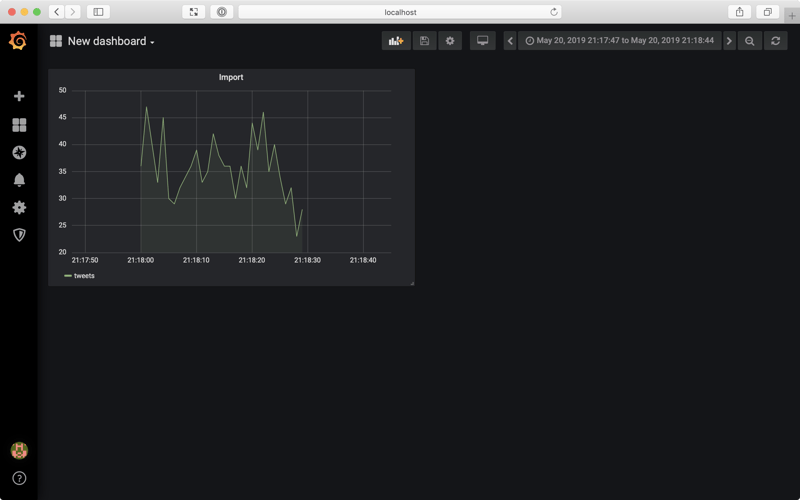
At this level of detail, we can see that throughout the data import, CrateDB was writing somewhere between 30 and 50 tweets per second. (Note: CrateDB can ingest millions of records per second. In this instance, the rate of ingestion is limited by the Twitter API and our ingestion method.)
From here, you can select the Vizualization tab from the left-hand icon menu and configure the visual appearance of the chart.
You can also set a title from the General tab.
Once you’re done, select the back arrow in the top left-hand corner of the screen to return to your new dashboard.
Here it is:
Wrap Up
In this post, I showed you how to get CrateDB and Grafana up-and-running on your local machine. We imported some tweets and then visualized the import process by graphing the number of imported tweets over time.
Grafana is an excellent tool for data visualization and a perfect fit for the sorts of time series and machine data use-cases CrateDB was built for.
This is a simple demo of what CrateDB and Grafana can do together. If this was a production app, it is likely we would have a continuous stream of data to monitor—and that’s where Grafana’s live dashboards really excel.
From here, you might want to continue with either the Grafana documentation or the CrateDB documentation.