In this tutorial, we will
- Create a table in CrateDB for the Iris dataset
- Set up the PostgreSQL-Driver for Tableau
- Connect to CrateDB from Tableau using PostgreSQL-JDBC
- Make a simple visualization from our CrateDB table in Tableau
Requirements:
- Tableau application (for instance, Tableau Desktop)
- PostgreSQL-JDBC driver
Downloading the Iris data
For this tutorial, we will use the famous Iris Dataset. It was used in R.A. Fisher's classic 1936 paper and includes data about three iris species with 50 samples each as well as some properties about each flower.
First, the dataset must be retrieved. Download the Iris dataset CSV file and save it to a folder on your machine. We can now make a table for our dataset from the CrateDB Admin UI.
Connecting to CrateDB and creating a table for the Iris data
In this tutorial, we use the ad-hoc method to install CrateDB, following this step-by-step tutorial. First, we download CrateDB (version 4.6.1) and unpack it. In the terminal, we navigate to the unpacked CrateDB root folder with the command
cd /crate-4.6.1
and run a single-node instance from CrateDB with./bin/crate
You should now be able to access the CrateDB AdminUI from your browser: go to the localhost at http://localhost:4200
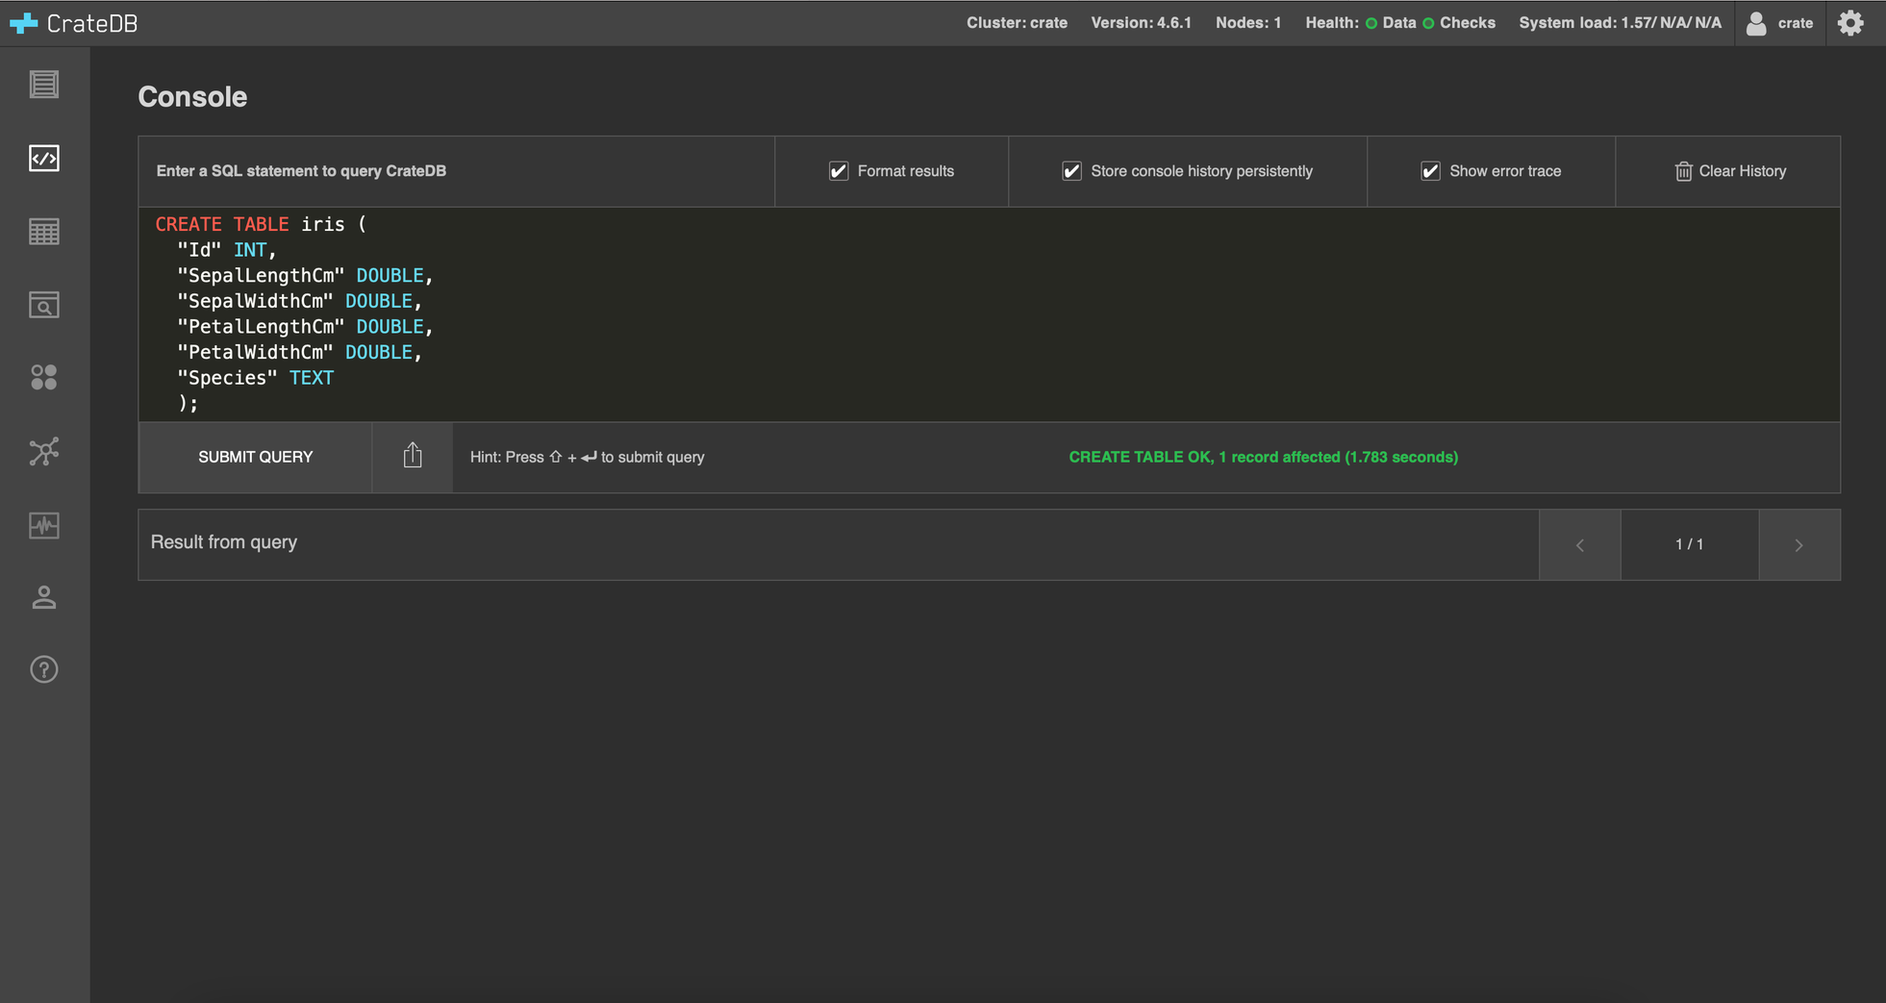
In the AdminUI, navigate to the console on the left side and create a table with the same column names as in the Iris' CSV file we just retrieved
- Attention! CrateDB is case-sensitive, and in this dataset, the column names are written in camelcase. To import the data successfully, we must create the table with camelcase column names by declaring the columns between quotes.
CREATE TABLE iris ( "Id" INT, "SepalLengthCm" DOUBLE, "SepalWidthCm" DOUBLE, "PetalLengthCm" DOUBLE, "PetalWidthCm" DOUBLE, "Species" TEXT);
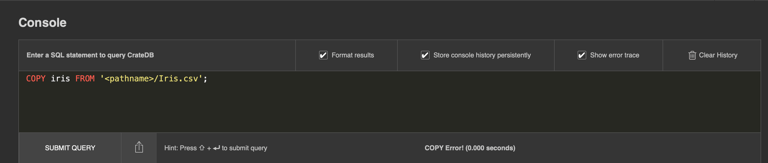
Then, copy the CSV file into the iris table by passing the <pathname> to where the file was saved in your machine (between single quotes).COPY iris FROM '<pathname>/Iris.csv';
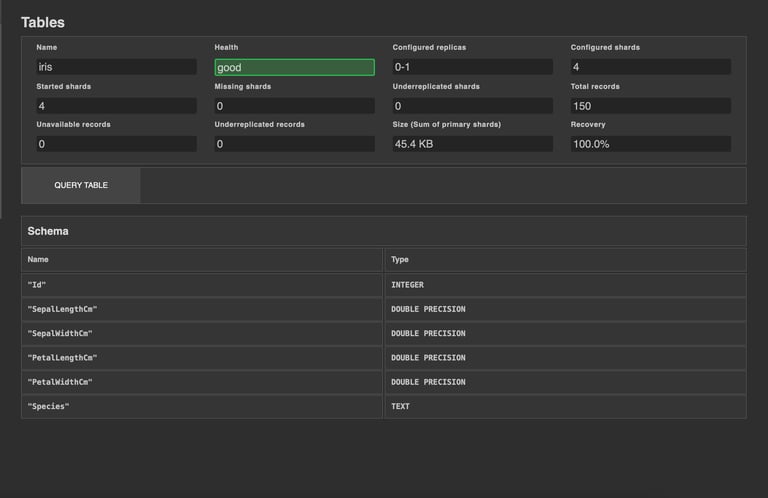
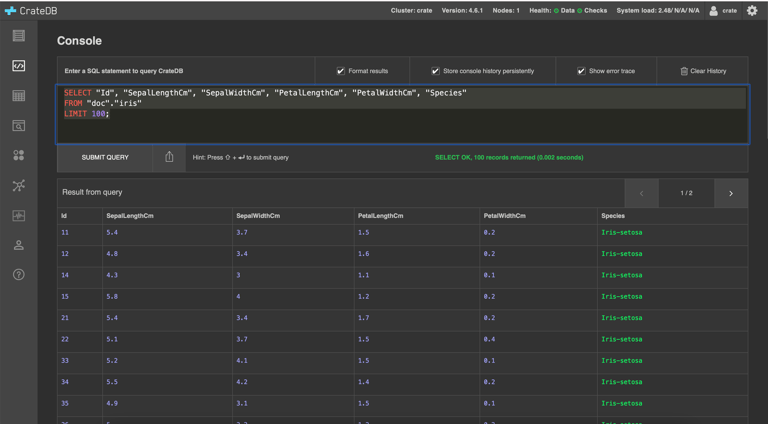
The iris table can now be found in the tables section from the AdminUI. We can visualize the data by clicking on QUERY TABLE.
Everything is set to now connect to CrateDB from Tableau.
Setting up PostgreSQL-JDBC as a Tableau driver
The following instructions show how to do it from a Mac machine:
After downloading the PostgreSQL-JDBC Drive, its jar file will automatically land on the Downloads section. This folder must be copied into the Tableau folder, which can be done the following way:
Open the terminal and navigate to the Downloads section with the commandcd downloads
then, run the following command to copy the PostgreSQL-JDBC jar file to the Tableau folder:cp postgresql-42.2.23.jar ~/Library/Tableau/Drivers
Now that the PostgreSQL-JDBC was copied, you can proceed to connect to CrateDB from Tableau:
Connecting to CrateDB from Tableau
On the main Tableau page, navigate to the Connect section on the left, go to …To a Server and select More…, where a list of Connectors is shown.
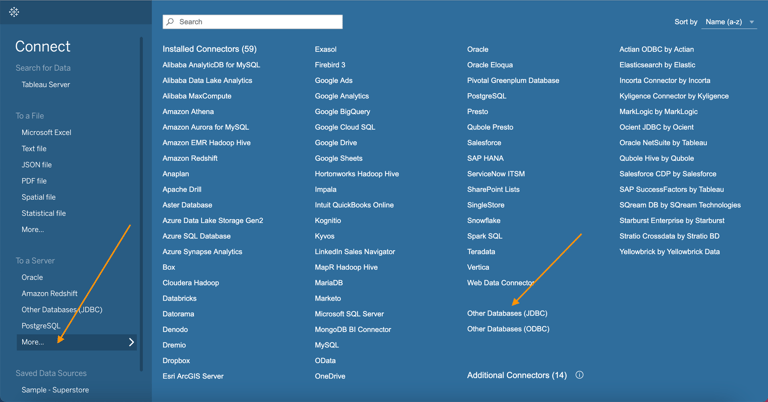
Select the Other Databases (JDBC) option, and then a connection window will pop up:
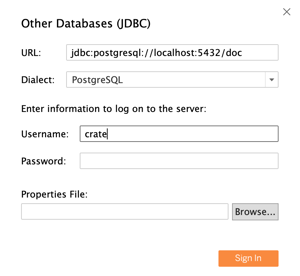
The default username for CrateDB is crate, with no password. It is also possible to log in with personalized credentials, as described in this CrateDB User Management tutorial.
When the connection is set, a Data Source page will open in Tableau. Once we select our database (doc) and our Schema (doc), a list of tables will appear on the left. Drag the iris table to the Drag tables here section to display its content
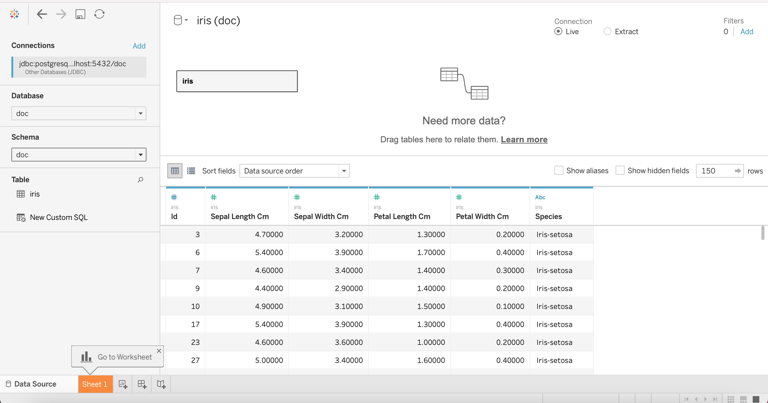
Now that we have access to our CrateDB data from Tableau, we can make a simple visualization.
Visualizing the Iris data
Create a new Tableau Sheet, where we will visualize our data.
On the Data section in the top left, select the iris table.
A list of its columns will appear on the bottom left, such as Species, Id, Petal Length Cm, etc. These columns can be dragged to the Columns and Rows sections to make visualizations.
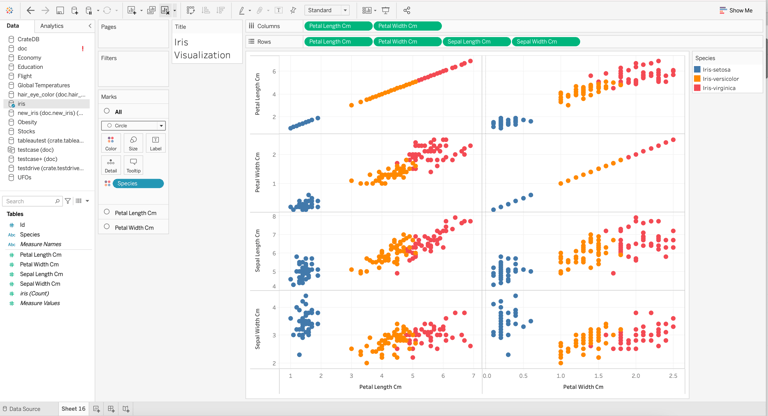
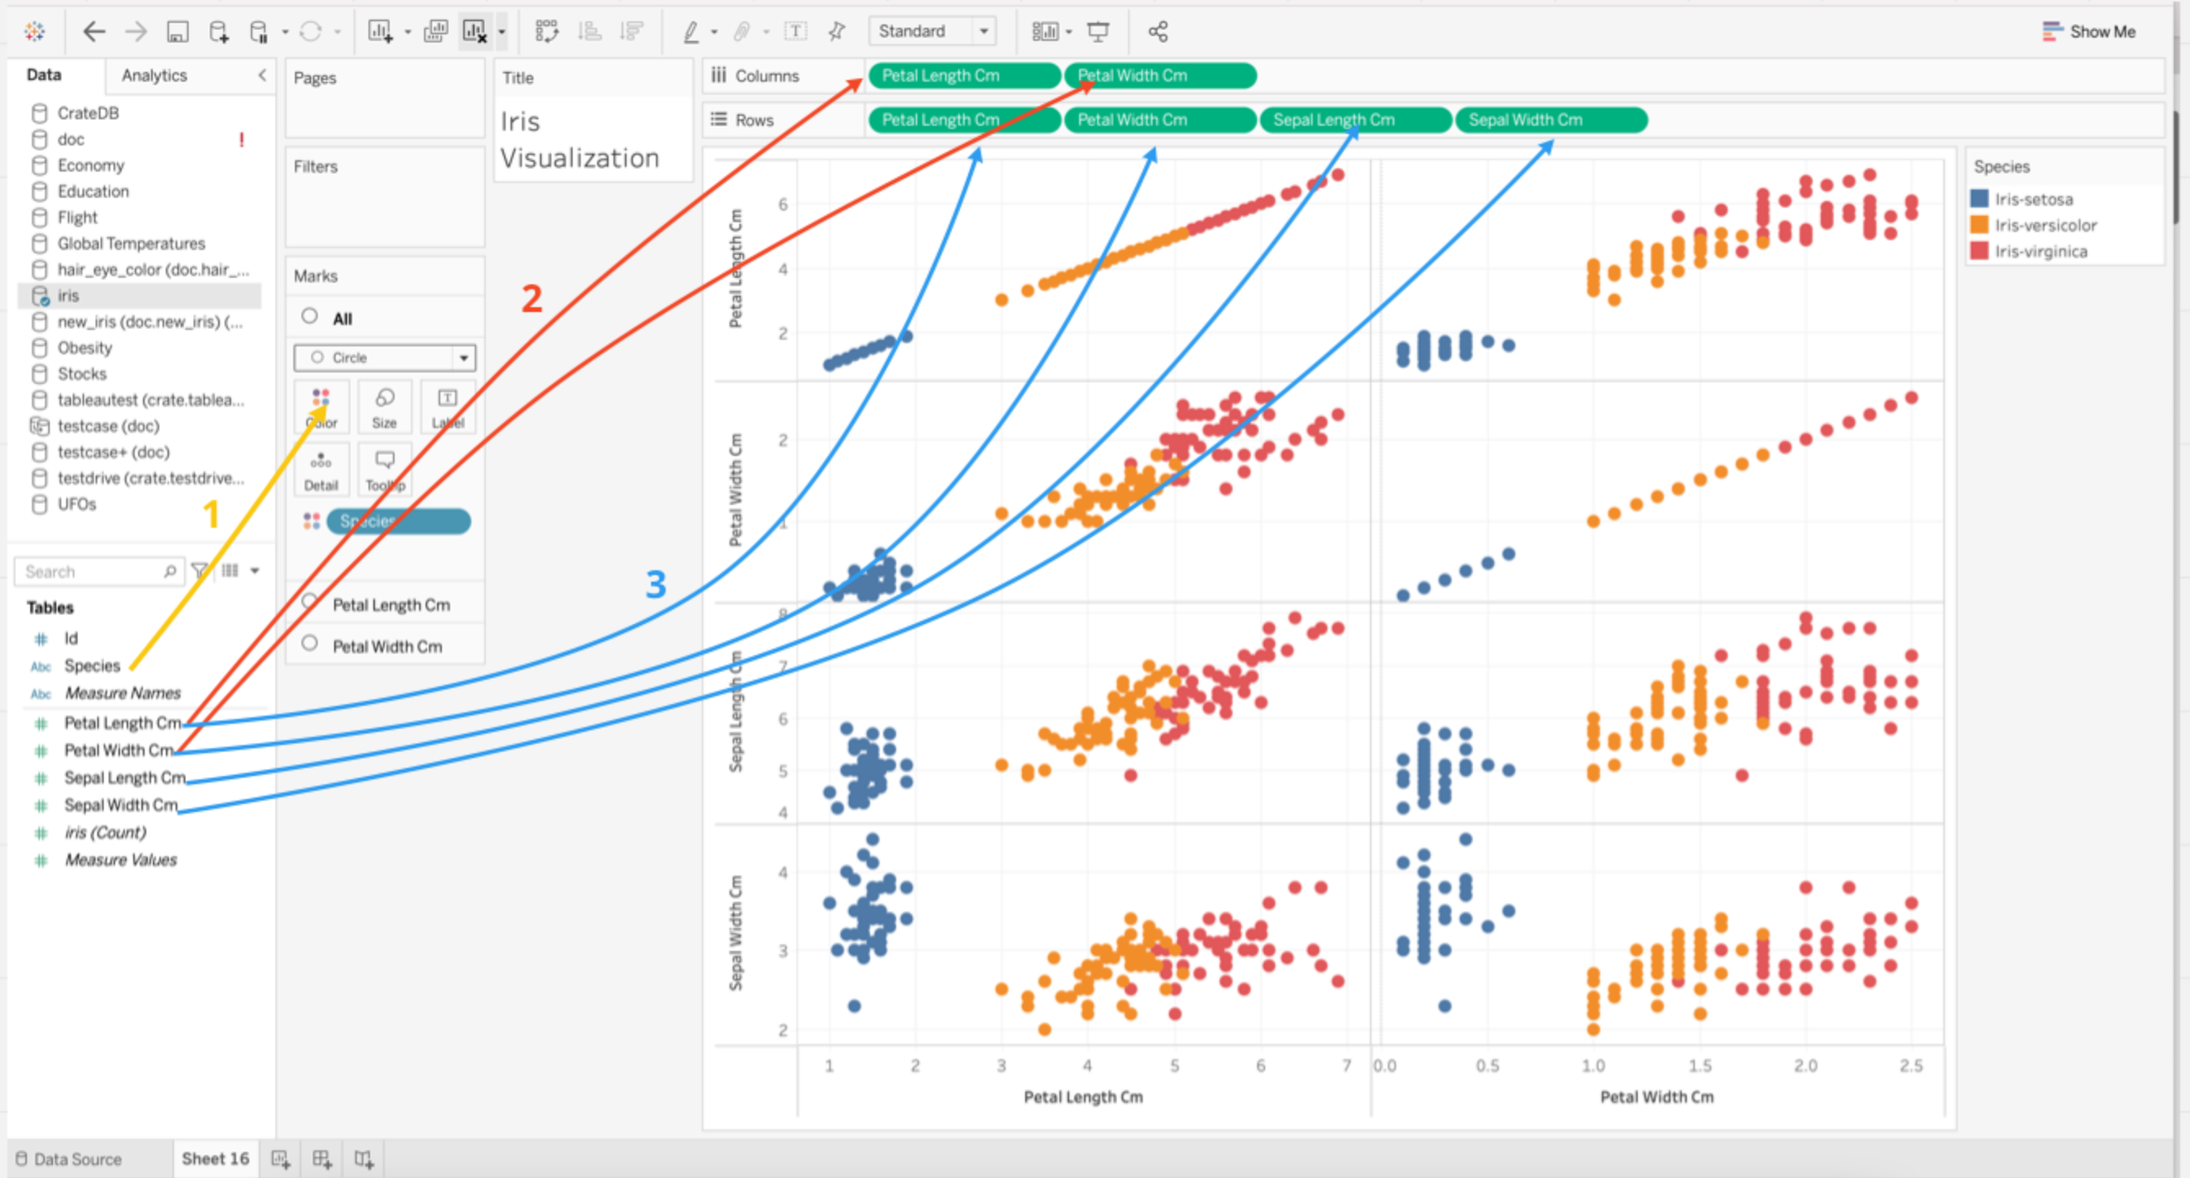
This visualization can be replicated by following:
- Drag the Species column to the Marks - ‘All’ section and place it over Color. By doing this, the different species will be represented by different colors
- Drag the Petal Length Cm and Petal Width Cm columns to the Columns section
- Drag the Petal and Sepal columns to the Rows section
To learn more about Tableau, visit their tutorials on https://help.tableau.com/current/guides/get-started-tutorial/en-us/get-started-tutorial-home.htm.