Note: we have published an updated version of this blogpost, using Grafana 7.4.3 and CrateDB 4.4.1. Read it here.
Grafana is an open platform for time series data visualization and monitoring that works well for time series analytics.
CrateDB is a distributed SQL database that makes it simple to store and analyze massive amounts of machine data in real-time.
It's a match made in heaven.
In this post, I will show you how to get started with CrateDB and Grafana 5.x on macOS, but these instructions should be trivially adaptable for Linux or Windows.
Install CrateDB
If you don't already have CrateDB running locally, it's relatively effortless to get set up.
Run this command:
$ bash -c "$(curl -L https://try.crate.io/)"
This command just downloads CrateDB and runs it from the tarball. If you'd like to actually install CrateDB a bit more permanently, or you are using Windows, check out our collection of super easy one-step install guides.
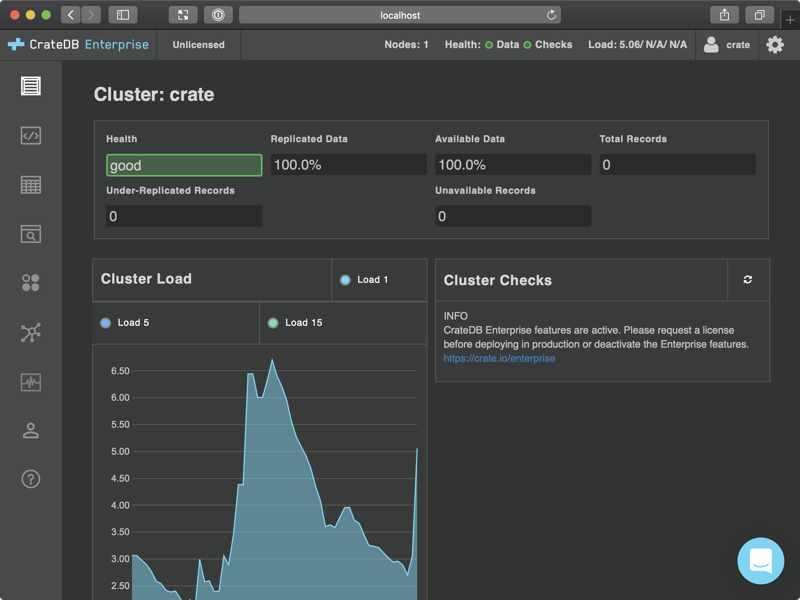
If you're using the command above, it should pop open the CrateDB admin UI for you automatically once it has finished. Otherwise, head over to http://localhost:4200/ in your browser.
You should see something like this:
Get Some Data
If you’re playing around with a fresh CrateDB install, it's likely that you don't have any data. So head on over to the Help screen by selecting the question mark icon on the left-hand navigation menu.
The help screen looks like this:
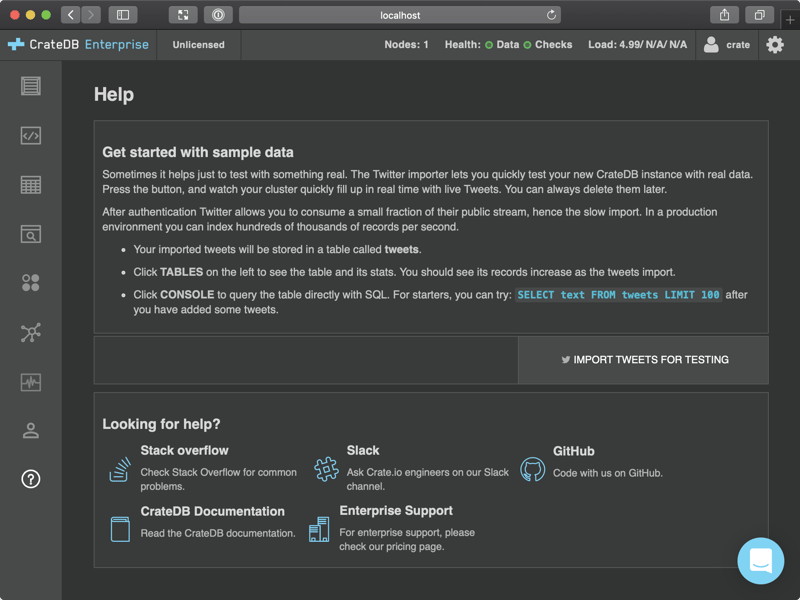
Select IMPORT TWEETS FOR TESTING and follow the instructions to authenticate your Twitter account.
Don't worry. This isn’t going to post anything on your behalf. It doesn’t even look at your tweets. All this does is import a bunch of recent public tweets on Twitter.
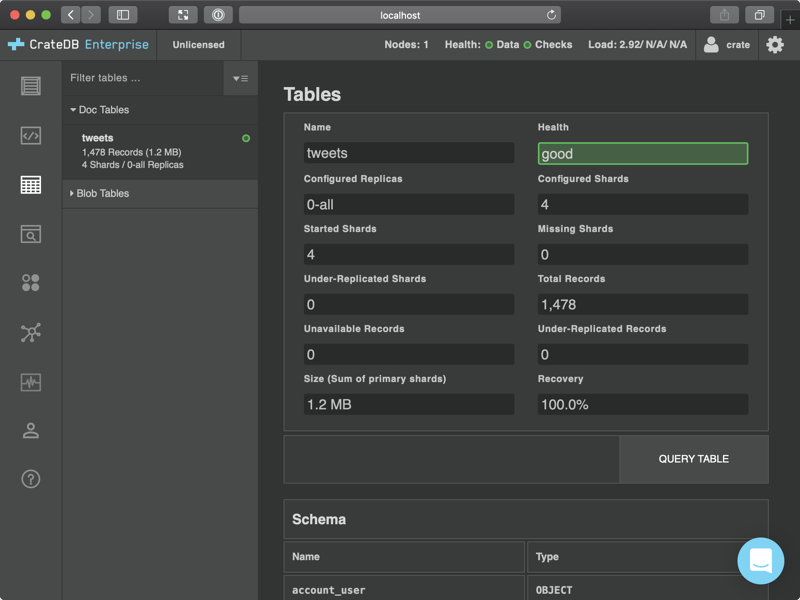
Once you're done, select the Tables icon from the left-hand navigation, and then select the tweets table. You should end up here:
http://localhost:4200/#/tables/doc/tweets
Which should look like this:
Get Grafana Running
Head on over to the Grafana download page. Select the operating system you're using and follow the instructions.
The current version of Grafana was 5.3.2 at the time of writing. You may have to adapt these instructions if you are running a newer version.
I'm using macOS with Homebrew installed, so I ran these commands:
$ brew update
$ brew install grafana
Then, to start Grafana up, I ran:
$ brew services start grafana
If you do the same, you should see something like this:
==> Tapping homebrew/services
Cloning into '/usr/local/Homebrew/Library/Taps/homebrew/homebrew-services'...
remote: Enumerating objects: 14, done.
remote: Counting objects: 100% (14/14), done.
remote: Compressing objects: 100% (10/10), done.
remote: Total 14 (delta 0), reused 9 (delta 0), pack-reused 0
Unpacking objects: 100% (14/14), done.
Tapped 1 command (43 files, 55.3KB).
==> Successfully started `grafana` (label: homebrew.mxcl.grafana)
Now, you can access the Grafana interface by visiting http://localhost:3000/ in your browser.
You should see something like this:
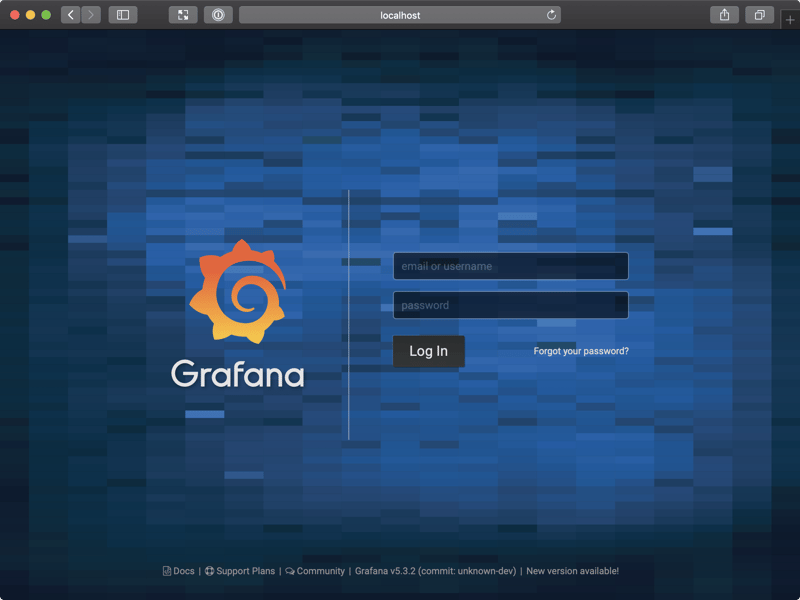
The default username admin and the default password is admin. Enter those on this screen. After doing so, you will be prompted to change your password.
Once you're logged in, you should see your Grafana home dashboard:
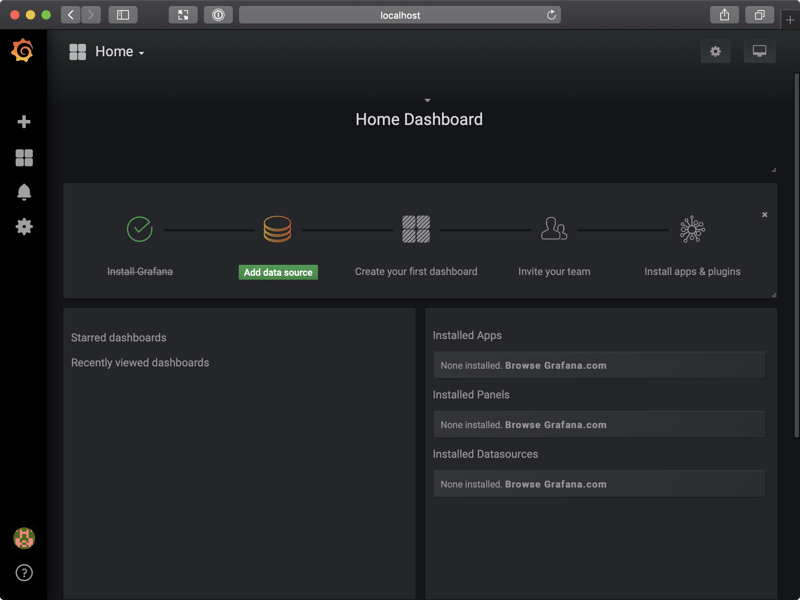
Add a Data Source
From the Grafana home dashboard, select Add data source.
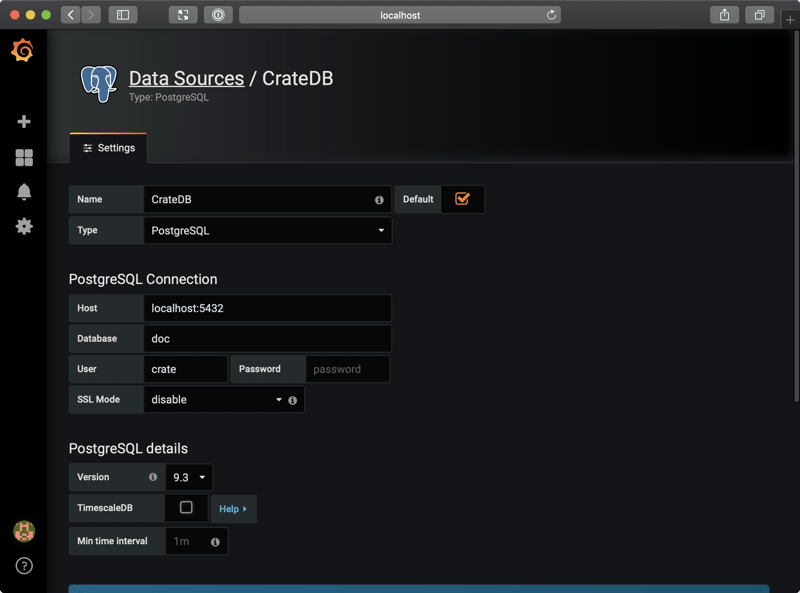
Select the "PostgreSQL" data source, and then:
- Name the data source "CrateDB"
- Tick Default
- Set the Host to
localhost:5432 - Set the Database to
doc - Set the User to
crate - Set SSL Mode to disabled
When you're done it should look like this:
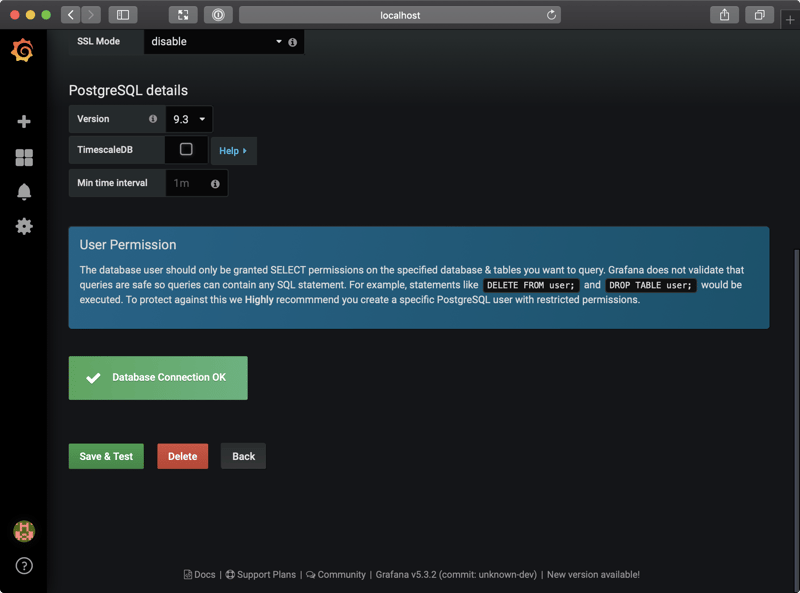
Select Save & Test.
You should see a success message that looks like this:
Set Up Your Dashboard
Go back to your Grafana home dashboard.
You should be invited to set up a new dashboard:
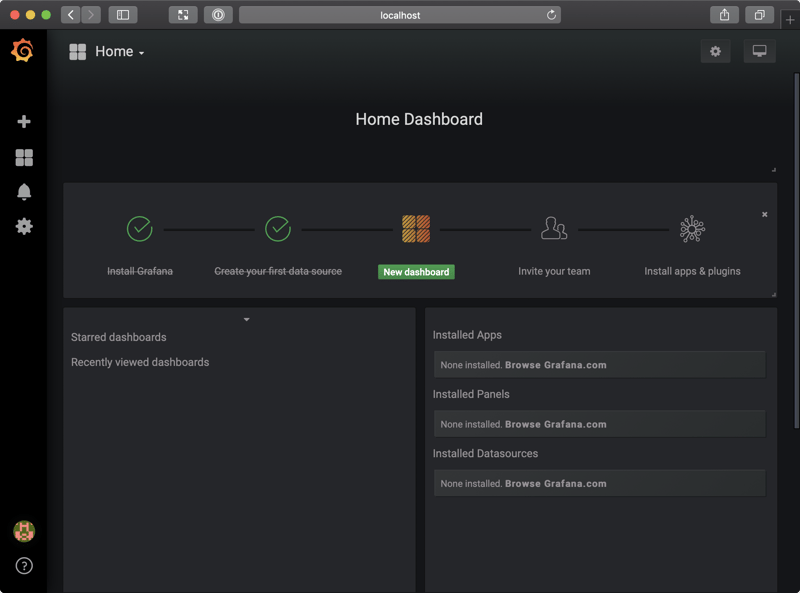
Select New dashboard.
The next screen should look like this:
We have some imported tweets. So let's work with that and graph the number of imported tweets over time.
Grafana dashboards are composed of building blocks called panels.
Let's add a panel to graph our tweet import data.
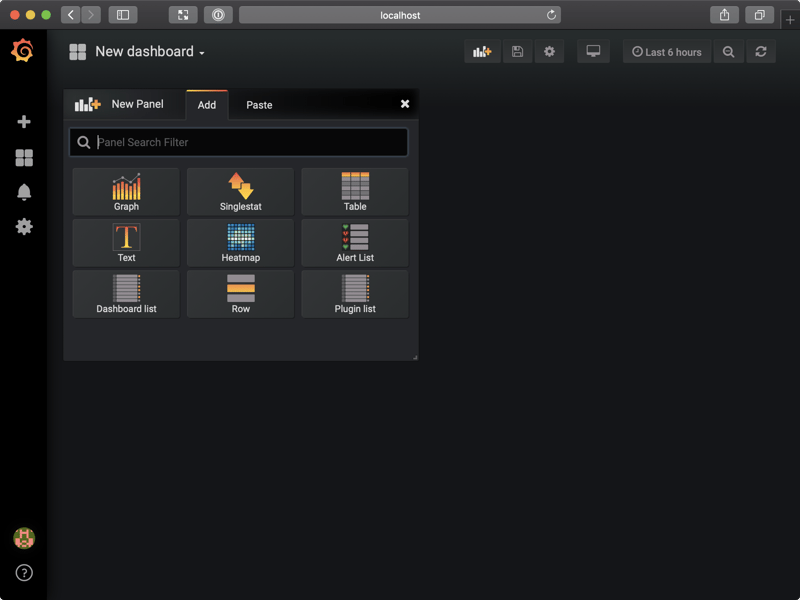
Select Graph from the New Panel widget (shown in the screenshot above).
Initially, you will be greeted with a screen that looks like this:
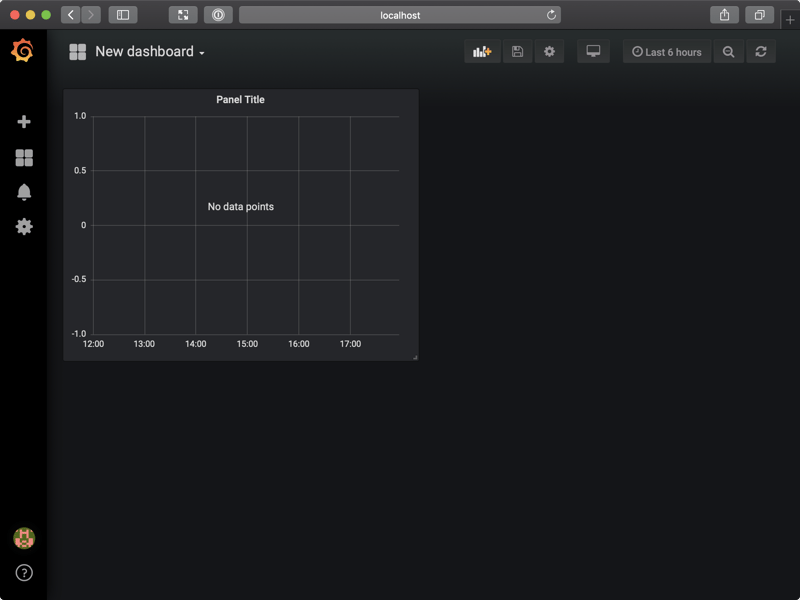
I know this seems like something went wrong, but there's no need to fret! We just need to configure the panel.
Click the panel title ("Panel Title" in the screenshot above) to get a drop-down menu, and from that menu, select Edit.
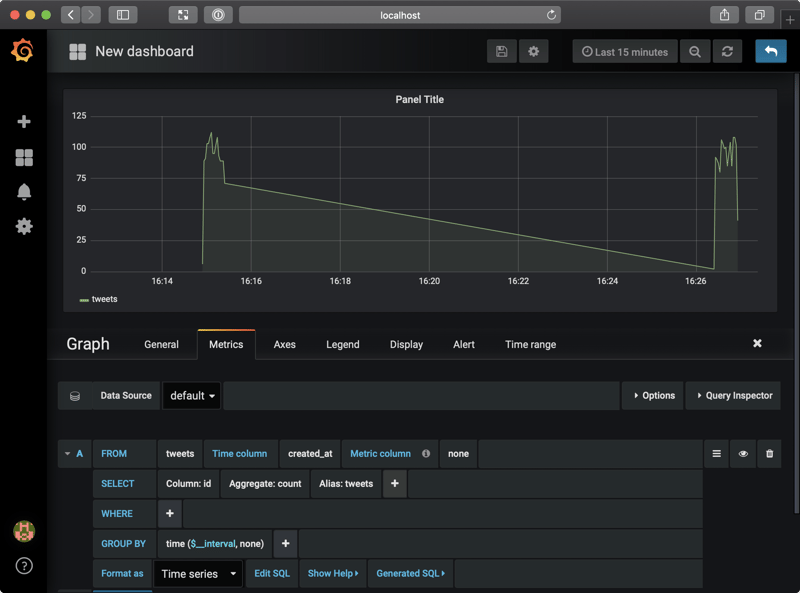
You should see a screen like this:
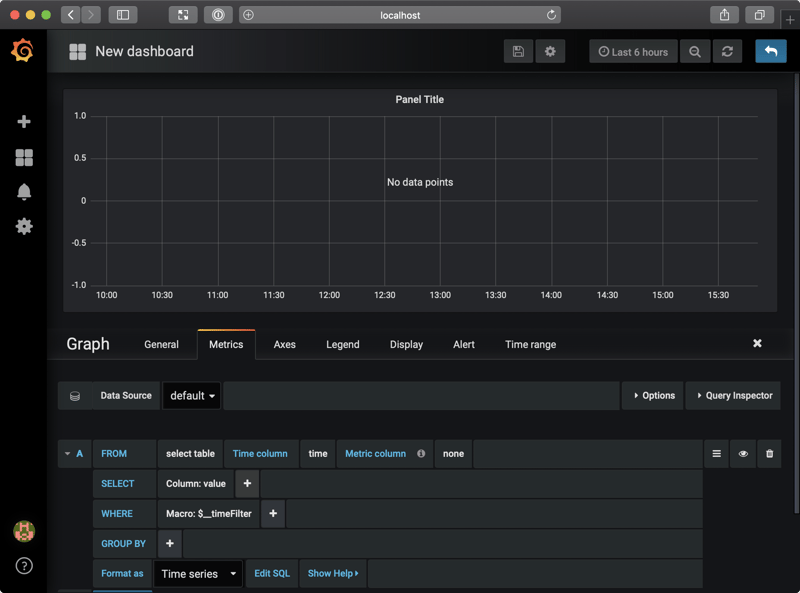
Use the query editor at the bottom of the screen, and do the following:
- On the FROM line, change "select table" to
tweets - Change "time" to
created_at
Then, finally:
- On the SELECT line, change Column to
id - Select the "+" next to Column, and then select Aggregate Functions, Count
- Change the Alias to
tweets
As you configure this, Grafana will set GROUP BY to time ($__interval, none). This is correct, so you can just leave it in place.
With this setup, we're instructing Grafana to plot a data point for each time window named tweets that corresponds to COUNT(id). That is, we want Grafana to plot the total number of unique tweets per time window (seconds, hours, etc.). The size of the time window can be adjusted in a later step.
The graph should update automatically. But there's a good chance your graph doesn't show much. That's because the default time period is six hours, and we only imported a small batch of tweets.
So, change the time period in the top right-hand menu from "Last 6 hours" to "Last 15 minutes", or whatever you prefer.
If you get an error message saying "Data points outside date range" it means that your import activity happened outside of the currently selected time period. (This might happen if you left a lot of time between doing the import and trying to graph the results.) You will need to adjust the time period so that it includes the tweets you imported.
When I did this, my screen looked like so:
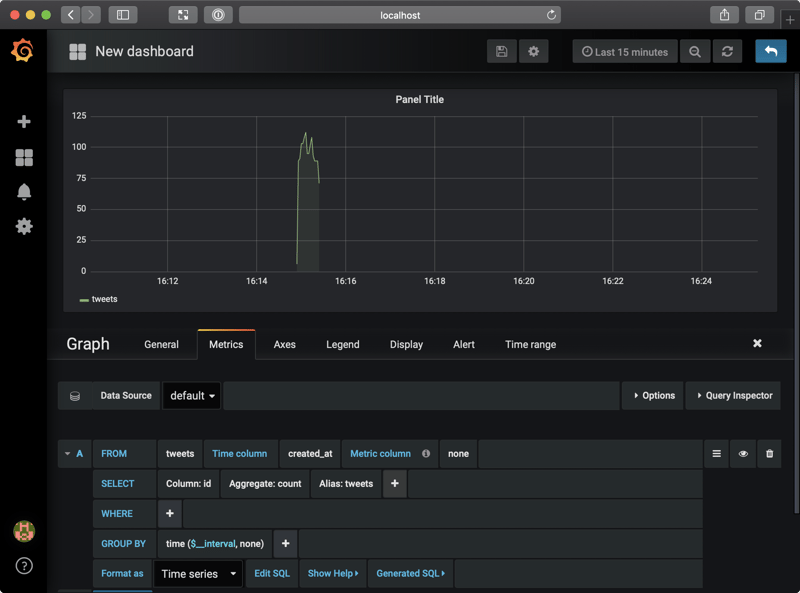
What this shows is that about 10 minutes ago, there was a flurry of activity as CrateDB imported a thousand or so tweets over about half a minute. (Note: CrateDB can ingest millions of records per second. In this instance, the rate of ingestion is limited by the Twitter API and our ingestion method.)
If you go back to the CrateDB admin UI help screen, you can select IMPORT TWEETS FOR TESTING again.
Now, you can refresh your Grafana dashboard (using the refresh icon at the top) or change the time period (which will also refresh the data).
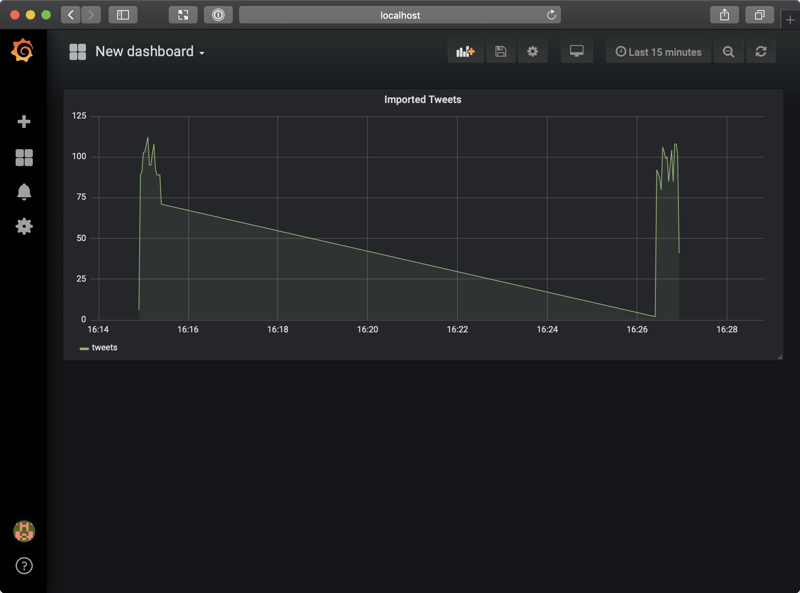
Here's what I saw after I imported some new tweets:
From here, you can select the General tab at the bottom of the graph, and rename the panel to something like "Imported Tweets".
When you're done, select the blue arrow icon at the top right and return to your dashboard.
After resizing the panel, my dashboard looked like this:
Naturally, if this was a production app, it is likely that we would have a continuous stream of data to graph.
One last thing. Make sure to select the floppy disk icon at the top of the screen to save your dashboard, choosing an appropriate name.
From here, you might want to continue with either the Grafana documentation or the CrateDB documentation.
Wrap Up
In this post, I showed you how to get CrateDB and Grafana up-and-running on your local machine. We imported some tweets and then visualized the import process by graphing the number of imported tweets over time.
This is the probably most simple demo of what CrateDB and Grafana can do together. Hopefully, however, it was enough to get you thinking about the possibilities for real-world applications.
Grafana is an excellent tool for data visualization and a perfect fit for the sorts of time series and machine data use-cases CrateDB was built for.