In my previous miniseries, I walked you through the process of running your first CrateDB cluster on Kubernetes.
In this post, I'm going to take it up a notch. :)
CrateDB Cloud is a new product we're building at Crate.io that provides managed CrateDB clusters running on Kubernetes.
We monitor these managed CrateDB clusters using two primary tools: Prometheus and Grafana.
Prometheus is an open source monitoring system that allows us to scrape metrics from a variety of sources. We can then query these metrics and build analytics and alerting systems on top of them.
Grafana is an open platform for time series data visualization and monitoring that works well for time series analytics.
We combine Prometheus and Grafana to produce a suite of reporting and alerting tools that let us spot infrastructure anomalies, monitor performance, and so on.
In this post, I show you how to do something similar. Specifically, I show you how to set up Prometheus and Grafana with CrateDB so that you can monitor CPU, memory, and disk usage, as well as CrateDB metrics like queries per second.
Set Up Prometheus
This post assumes you already have a CrateDB cluster running on Kubernetes. If that is not the case, my previous Kubernetes miniseries shows you how to get your first cluster spun up. Once that's done, come back to this post.
With a CrateDB cluster running, the next thing we need is a working Prometheus setup to scrape the data we want to monitor. (Later, once we have that data, we can graph it with Grafana.)
We already have the crate namespace for our CrateDB stack. But let's keep our monitoring stack separate. This will allow us to monitor multiple stacks, should we want to expand our setup later.
Create the new namespace:
$ kubectl create namespace monitoring

namespace/monitoring created
By default, Kubernetes pods in separate namespaces do not have access to each other. But Prometheus needs access for monitoring purposes, so we're going to have to configure that explicitly.
Configure RBAC
We can allow Prometheus to access separate namespaces using Kubernetes Role Based Access Control (RBAC) authorization. In a nutshell: RBAC allows you to define roles along with their associated privileges.
The first step is to define a prometheus role:
Here, we're using a ClusterRole because Prometheus should have access to different namespaces across the Kubernetes cluster. (The alternative is a Role, which is restricted to a single namespace.)
In the rules section, we:
- Grant
get,list, andwatchpermission on thenodes,nodes/proxy,services,endpoints, andpodsresource type APIs - Grant the
getpermission onconfigmapsresource type APIs - Grant the
getpermission on the/metricsendpoint
This covers the full list of operations Prometheus needs to be able to monitor a CrateDB cluster running in a separate namespace.
Now we have a prometheus ClusterRole defined, we can bind it (using a ClusterRoleBinding) to any users and service accounts that we want.
Prometheus is a process, so we should use a ServiceAccount.
Here's a basic ServiceAccount definition:
And here's the ClusterRoleBinding configuration that binds the ClusterRole and ServiceAccount together:
The three configurations (ClusterRole, ServiceAccount, and ClusterRoleBinding) can be kept in the same file. Let's call it prometheus-rbac.yml.
Here's a combined snippet I prepared earlier.
On GitLab, select the Download button in the top right-hand corner of the file viewer to save the file to your local machine.
Once saved, create all three RBAC configurations like so:
$ kubectl create -f prometheus-rbac.yaml

clusterrole.rbac.authorization.k8s.io/prometheus created
serviceaccount/prometheus created
clusterrolebinding.rbac.authorization.k8s.io/prometheus created
Configure Prometheus
With RBAC configured, we can now add a basic ConfigMap for Prometheus. Let's use the official configuration file example provided by Prometheus. It's too big to embed here, but check it out on GitLab.
Save this file as prometheus-configuration.yaml and then run:
$ kubectl create -f prometheus-configuration.yaml

configmap/prometheus-configuration created
Configure a Prometheus Service
The next thing we need to do is create a service so that we can access Prometheus.
Here's a basic definition:
Note the prometheus.io/scrape: 'true' annotation. This is what Prometheus uses to determine which pods and services to scrape for metrics. I'll come back to that later.
Create the service:
$ kubectl create -f prometheus-service.yaml

service/prometheus created
Configure the Prometheus Controller
Finally, we need a controller that manages our Prometheus pod.
Here's a basic setup:
Let's break down that configuration:
- We are using Prometheus 2.5.0, which is the latest version at the time of writing
- Prometheus will retain its metrics for 12 hours
- The pod is limited to 500 millicpu and 500 MB
- The configuration defined by the ConfigMap we created previously is mounted at
/etc/prometheus
Create the controller like so:
$ kubectl create -f prometheus-deployment.yaml

deployment.extensions/prometheus created
After running this command, Kubernetes should initialize your pod. Once initialized, you will have a Prometheus instance running that scrapes any pods or services with the prometheus.io/scrape: 'true' annotation.
Test Your Setup
To verify that your Prometheus is running, expose the service via minikube:
$ minikube service list -n monitoring
|------------|------------|-----------------------------|
| NAMESPACE | NAME | URL |
|------------|------------|-----------------------------|
| monitoring | prometheus | http://192.168.99.100:32739 |
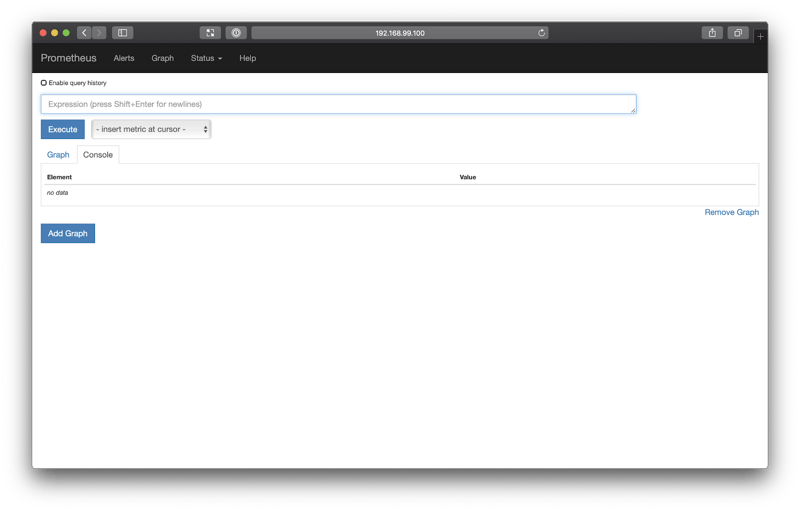
|------------|------------|-----------------------------|Navigating to the URL in the output table and you should be greeted with the Prometheus dashboard:
Because the Prometheus pod has the prometheus.io/scrape: 'true', Prometheus should already by scraping the metrics from its own pod. You can test this by querying prometheus with this expression:
container_memory_usage_bytes{container_name="prometheus"}Copy and paste this into the expression input field, and then select Execute. After switching to the Graph tab, you should see a graph like this:
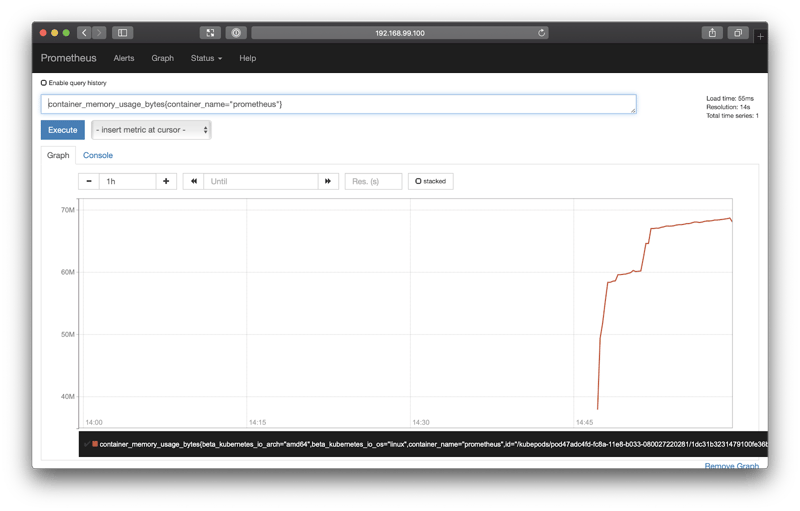
Fantastic! This shows us the memory consumption of the Prometheus pod over the last hour.
Enable CrateDB JMX Monitoring
Before we can get Prometheus to scrape metrics from CrateDB, we need to make a few changes to our CrateDB configuration.
Configure the Prometheus JMX Exporter
To scrape CrateDB, we're going to make use of Java Management Extensions (JMX) and the CrateDB JMX monitoring feature.
To use JMX monitoring with Prometheus, we need to use the JMX exporter to expose JMX metrics via an HTTP endpoint that Prometheus can scrape.
Before we change the CrateDB controller configuration, we need to create a ConfigMap for the JMX exporter so that we can translate a few of the JMX metrics into metrics that make more sense for Prometheus:
Create this ConfigMap, like so:
$ kubectl create -f crate-jmx-configuration.yaml -n crate

configmap/crate-jmx created
Update the CrateDB Controller
With the JMX exporter ConfigMap in place, we can update the CrateDB controller configuration used in the previous miniseries so that it looks like this:
That's a lot to take in.
Let's break down what changed:
-
We set
license.enterprise=true, because JMX monitoring is an enterprise feature. -
We add a bunch of
jmxremoteconfiguration options toCRATE_JAVA_OPTSto configure JMX monitoring. -
We expose port 6666 as a
containerPortfor JMX. -
We add a
wget-jmx-jarinit container. This downloads the JMX exporter JAR file and stores it on a mounted volume. -
We mount the volume with the JMX exporter JAR file using the
jmxdirvolumeMountsandvolumes. -
We configure JMX using the ConfigMap we created earlier using the
crate-jmxmountPathandconfigMap. - We add a
javaagentoption toCRATE_JAVA_OPTSto enable the JMX exporter JAR. Note the use of7071in configuration string. This is the port that Prometheus metrics will be exposed on. - We expose port 7071 as a
containerPort. - Finally, we set the
prometheus.io/scrape: 'true'andprometheus.io/port: '7071'annotations. This instructs Prometheus to scrape metrics from port 7071.
Download this file, and replace your CrateDB controller, like so:
$ kubectl replace -f crate-controller.yaml

statefulset.apps/crate replaced
Kubernetes should then start to update your CrateDB pod.
Test the JMX Exporter
Once your CrateDB pod has been updated, JMX metrics should start to be scraped into Prometheus.
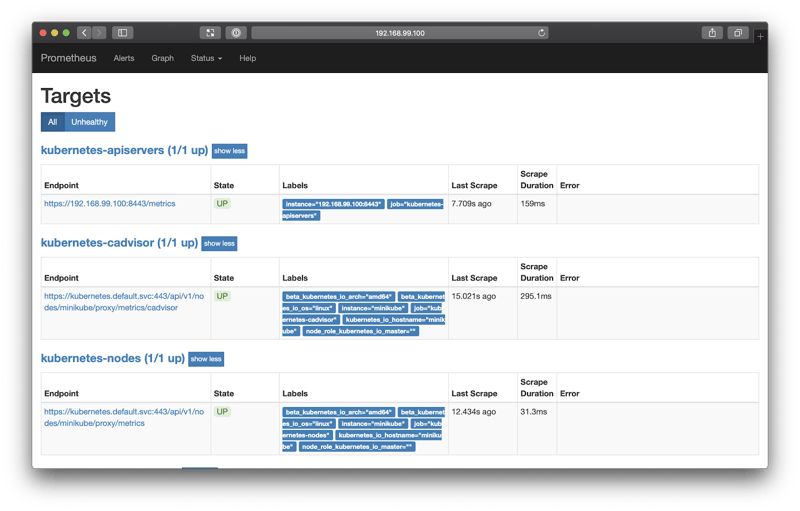
You can verify this by bringing up the Prometheus dashboard again and selecting Status from the top navigation bar, and then Targets.
You should see three targets:
Now that JMX metrics are being scraped, you can query Prometheus.
Go back to the query screen, and issue this query:
jvm_memory_bytes_used{area="heap", namespace="crate"}When I did this, I switched to the Graph tab and changed the graph period (the first input at the top) to 5m (five minutes).
If you do the same, you should see something like this:
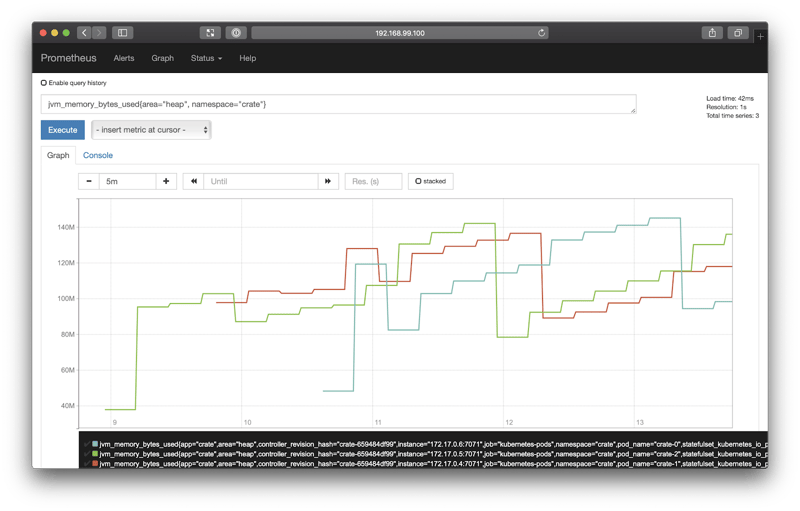
This query is particularly useful because it allows us to monitor the Java Virtual Machine (JVM) memory usage. JVM memory usage can be used to determine things like performance bottlenecks, memory leaks, and so on.
Over time, a healthy CrateDB instance's JVM memory usage should look like a sawtooth pattern. This is because heap usage accumulates steadily over time, and is then released by the Java garbage collector.
Set Up Grafana
Prometheus is a useful tool for scraping metrics, but it isn't so useful for monitoring purposes.
So, let's deploy a Grafana instance and configure Prometheus as a data source. Grafana will then let us assemble a monitoring dashboard.
Get Grafana Running
We only need three components for Grafana:
- An authorization secret for our login credentials
- A service to expose the pod
- A controller to manage the pod
Grafana has a web administration panel that requires you to log in before you can use it. It's good practice to configure user accounts in Kubernetes so that they persist across multiple deployments. You can do that using Kubernetes secrets.
Let's create an admin user with the password "admin".
Kubernetes require that secret values be base64 encoded. We can get the necessary encoded string, like so:
$ echo -n 'admin' | base64

YWRtaW4=
Then insert that into a secret:
Create the secret:
$ kubectl create -f grafana-secret.yaml

secret/grafana created
Once the secret has been created, we can define a service, like this:
Then, create the service:
$ kubectl create -f grafana-service.yaml

service/grafana created
Finally, let's define a basic StatefulSet controller that mounts the secrets:
Create the controller:
$ kubectl create -f grafana-controller.yaml

statefulset.apps/grafana created
After you run this command, Kubernetes will initialize your pod.
Once the pod is running, you can grab the Grafana URL:
$ minikube service list -n monitoring

|------------|------------|-----------------------------|
| NAMESPACE  |    NAME    |             URL             |
|------------|------------|-----------------------------|
| monitoring | grafana    | http://192.168.99.100:30288 |
| monitoring | prometheus | http://192.168.99.100:32739 |
|------------|------------|-----------------------------|
This will bring up the login screen:
Log in using the username and password you defined in the secret. When prompted to set a new password, you can skip that step.
Configure the Prometheus Data Source
Once you're logged in, you should see the home dashboard:
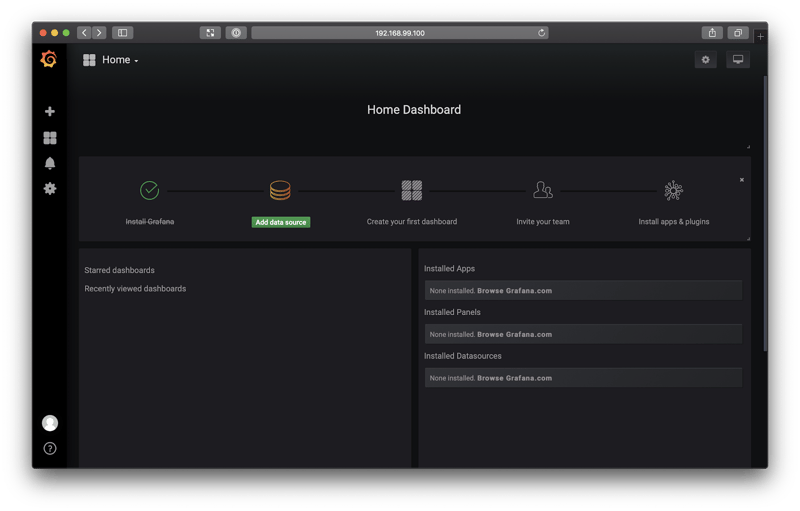
From this screen, select Add data source.
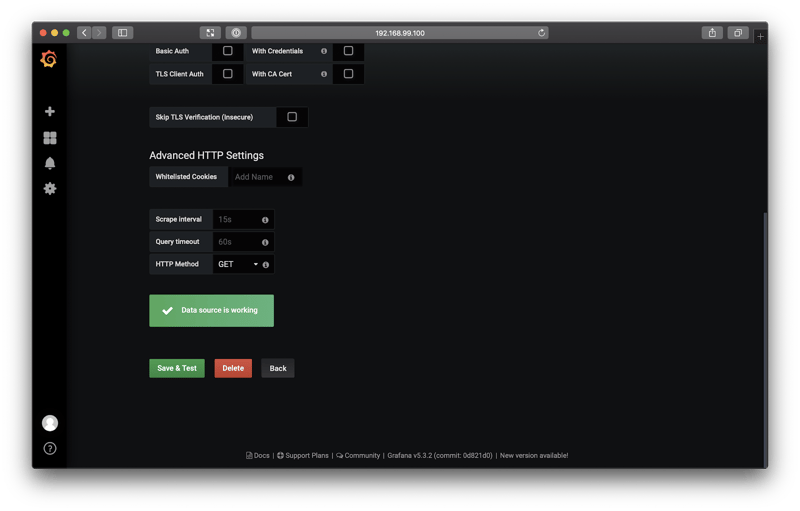
Grafana comes with a Prometheus data source by default. So, select that from the Type drop-down, and then configure the data source like so:
- Name: Prometheus
- URL:
http://prometheus:9090/
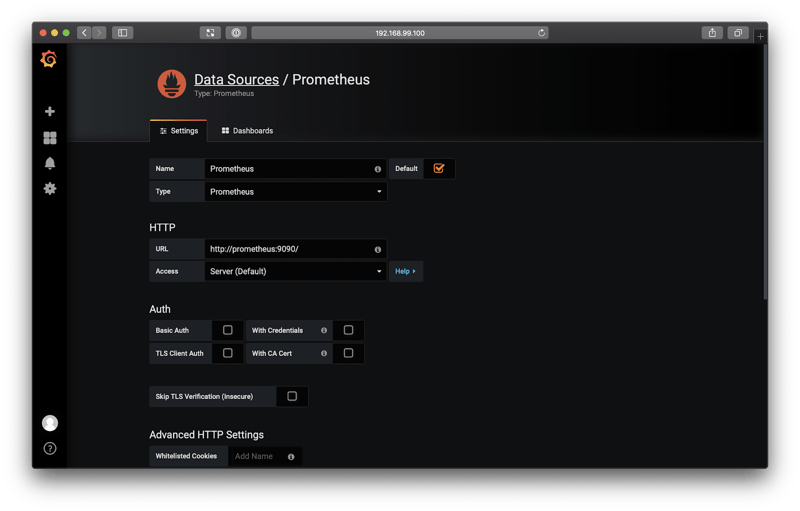
Scroll down, and select Save & Test. You should see a confirmation message saying "Data source is working".
Set Up Your Dashboard
Go back to your Grafana home dashboard.
You should be invited to set up a new dashboard:
Select New dashboard.
The next screen should look like this:
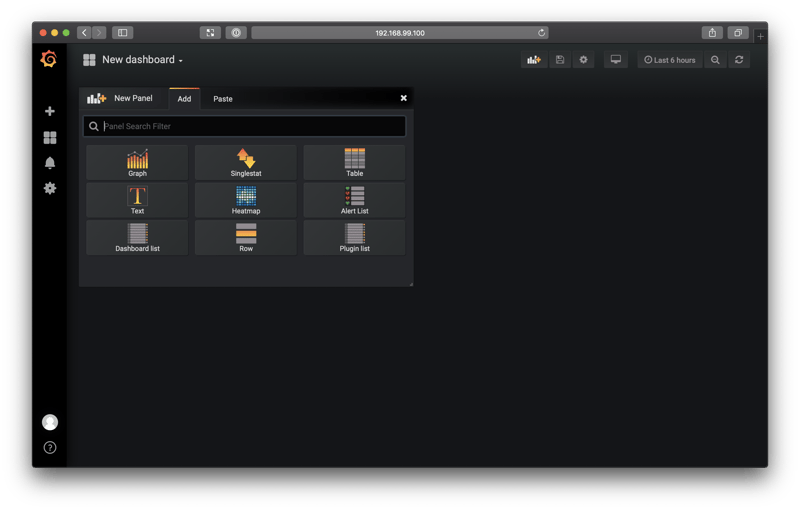
Grafana dashboards are composed of building blocks called panels.
Select Graph from the New Panel widget (shown in the screenshot above).
Initially, you will be greeted with a screen that looks like this:
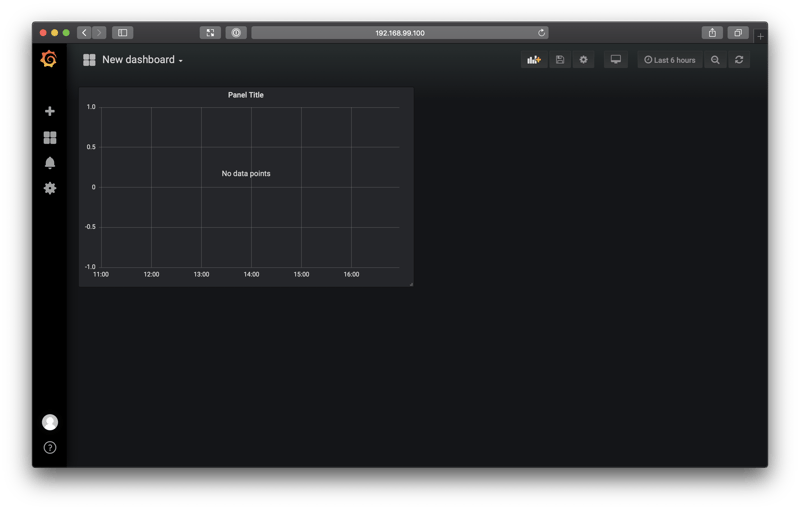
This might look like something went wrong, but this is just what an unconfigured graph looks like.
The next thing we need to do is configure it.
Click the panel title ("Panel Title" in the screenshot above) to get a drop-down menu, and from that menu, select Edit.
You should see a screen like this:
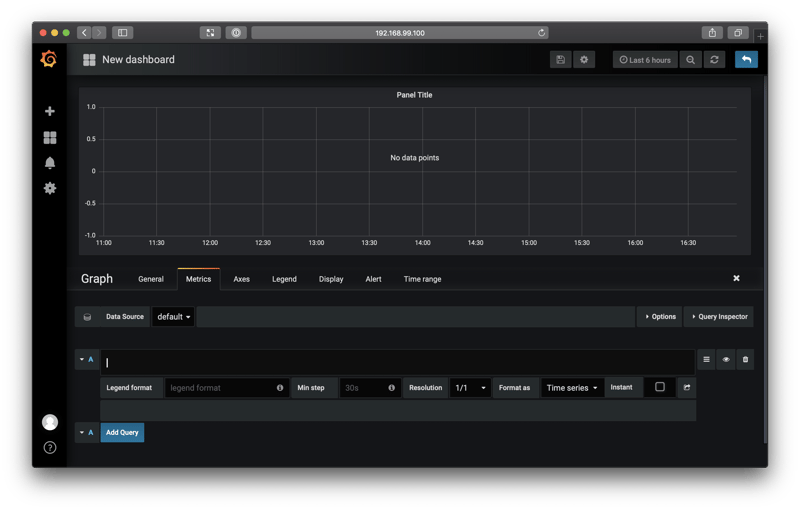
You can execute queries against Prometheus using the query box with the "A" label.
Let's start with this query:
jvm_memory_bytes_used{area="heap", namespace="crate"}Select Add Query.
You should see something like this:
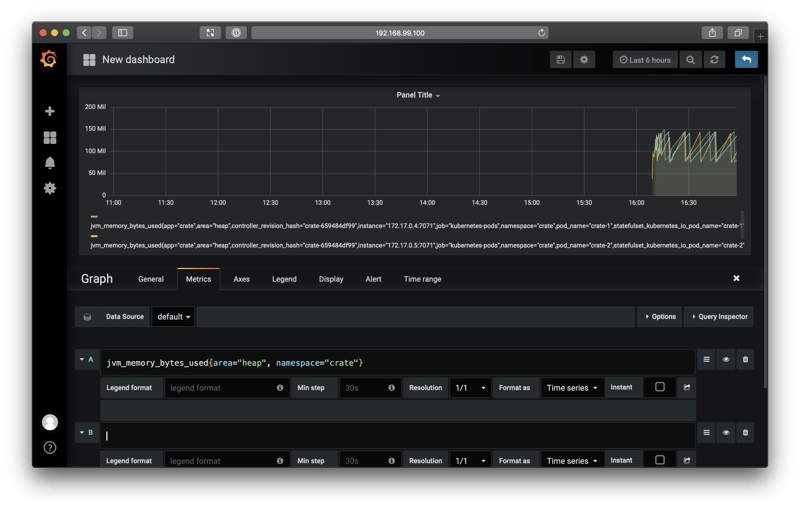
Here we see a graph of the JVM memory usage, like before.
We need to make a few tweaks:
- Navigate to the Axes tab, and change the Unit to "data (Metric)", "bytes"
- Navigate to the Legend tab, and disable the legend
- Navigate to the General tab, and change the title to "JVM Bytes Used"
Then, select the blue return arrow from the top right-hand menu.
You should be returned to the dashboard screen, and your panel should have a graph in it. Select the resize handle from the bottom right-hand corner of the panel, and drag it out to fill the whole width of the screen.
Finally, select the save icon (a floppy disk) from the top menu, and name your dashboard "CrateDB".
When you're done, you should see something like this:
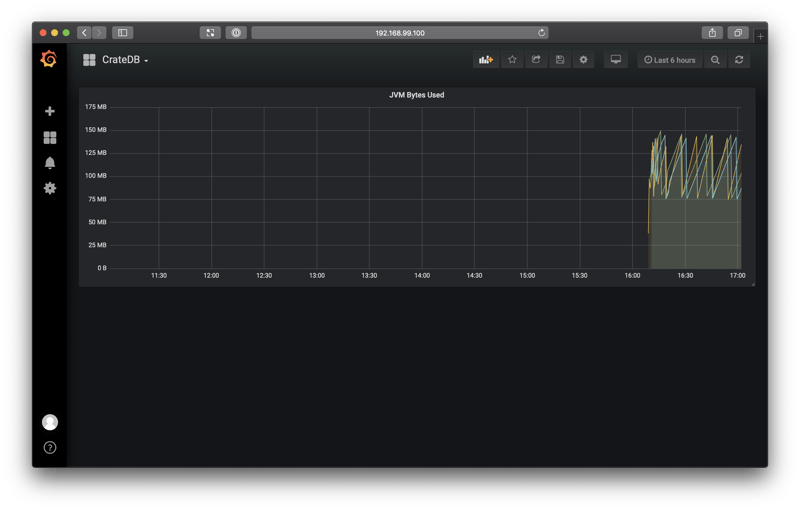
Great!
Let's add two more graphs.
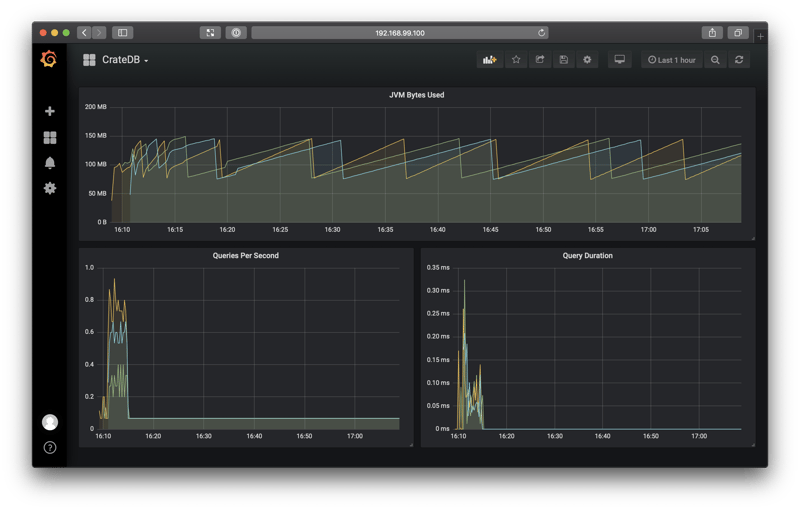
Follow a similar procedure as before, but use the following two queries:
-
Queries Per Second
avg(crate_queries{namespace="crate", container_name!="POD",query="Overall"}) by (query, namespace, instance, kubernetes_pod_name)This graph will display the average number of all query types being executed by your CrateDB cluster.
-
Query Duration
avg(crate_query_duration_seconds{namespace="crate", container_name!="POD", query="Overall"}) BY (query, namespace, instance, kubernetes_pod_name)Set the units to milliseconds.
This graph will display the average query duration for all query types.
When you're done, you should have a dashboard like this:
If you use the CrateDB admin UI to import some test data, you should see that new activity reflected on your dashboard:
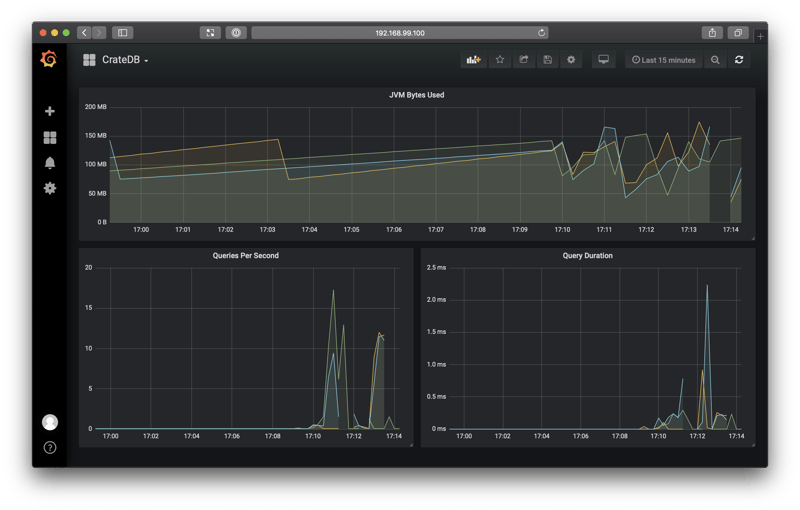
Note: I changed the dashboard time range from one hour to 15 minutes using the time range button in the top right-hand menu.
Wrap Up
In this post, I showed you how to:
- Augment your CrateDB Kubernetes cluster with two monitoring tools: Prometheus and Grafana
- Enable and use the CrateDB JMX monitoring feature
- Create your first Grafana dashboard to monitor the health and performance of your CrateDB cluster
From here, you can start to expand your dashboard. In the two CrateDB queries above, you can change query="Overall" to query specific query types: SELECT, INSERT, UPDATE, and DELETE.
For example, to graph the average query execution time for inserts only, you could use this expression:
avg(crate_query_duration_seconds{namespace="crate", container_name!="POD", query="Insert"}) BY (query, namespace, instance, kubernetes_pod_name)Consult the CrateDB JMX monitoring documentation for more information.
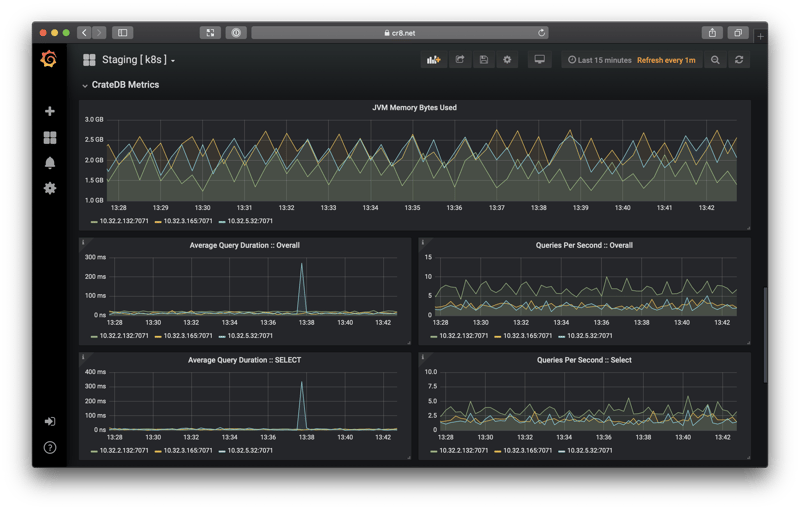
Finally, here's a screenshot from a real-world cluster: