CrateDB is running in production in companies around the world, with users applying a range of different monitoring solutions to ensure cluster (hardware) health and responsiveness in addition to providing indicators whether the cluster size should be changed.
The most important part of monitoring a CrateDB cluster is the understanding of which metrics you care about and why. At Crate.io we are trying to keep things simple and we have included some fundamental metrics in the AdminUI.
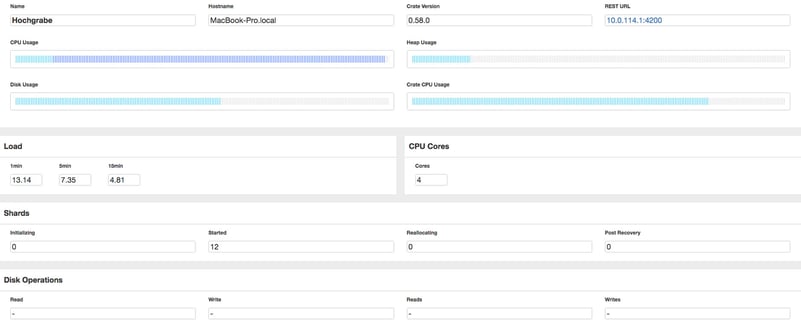
The numbers provided indicate a general load on the machine as well as within CrateDB:
- CPU (overall and CrateDB) usage
- Heap usage
- Disk usage
- Disk I/O
For use with CrateDB we recommend monitoring at least the numbers listed above in order to better understand the health of cluster. It can make sense for large clusters to monitor a node's network connection to see if the infrastructure is causing a bottleneck or to identify nodes with an unusual amount of client connections. While common monitoring tools (Scout, Nagios,…) provide these metrics by default, standard Linux tools are also a great way to get other metrics, like the number of active connections: netstat -an | grep :4200 | wc -l provides the number of active TCP connections on port 4200, (CrateDB's HTTP port).
To keep an eye on commonly monitored metrics like the 95th percentile of query times, slowest queries, inserts per second, etc. a common method is to look into CrateDB's actual response times by activating the sys.jobs table and periodically check query times recorded there.
CPU
CPU is tracked using the load metric of your OS, which is determined by how many CPU tasks (either threads or processes) are queued at a certain time. CrateDB dedicates considerable time to working on CPU-intensive tasks, which is why this number is probably the most important indicator for high load. To recognize a long-term high load on the cluster, look at the 15-minute load average: A sustainable cluster should have a load lower than 0.7 per core per CPU.
Memory (heap)
Memory management can be tricky in Java applications since there is runtime garbage collection which is occasionally hard to predict. However, any query (or insert/update/delete) requires enough memory to run, otherwise our CircuitBreaker causes the query to fail in order to protect the user from OutOfMemory exceptions. The CircuitBreaker's limits can be adjusted but it's usually recommended to optimize the queries to test for their involvement in underlying problems, when encountered. In general the amount of memory provided should reflect the query load (also, see 'Queries' above) - concurrency and result sets as well as client connections should be taken into account!
Disk (I/O)
The disk is CrateDB's data store and optimized indices aside, the disk will be utilized for each query and especially COPY FROM can saturate the disk's I/O capacities. Additionally, with growing data sizes and replication, monitoring disk space and I/O performance is critical to ensure that a cluster continues to serve reliably. Particularly the disk usage is something CrateDB can be picky about and for larger disks it's recommended to set the watermarks accordingly.
Diagnostics Monitoring
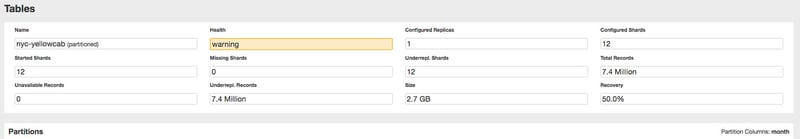
Sometimes things go wrong without the cluster going down or any significant resource usage. For these scenarios it's important to keep an eye on different metrics in order to avoid possible data loss! A simple summary is the cluster state, which describes the data health in 3 colors and the log which indicates causes for errors on clients.
Cluster State and Recovery
CrateDB's data health is summed up using three colors: Red, Yellow, and Green. While Green says 'all good', and every table is replicated as configured, Yellow indicates a warning where something is not as configured: Tables might be replicating just now or there are not enough nodes to replicate in a meaningful way (e.g. if there are more replicas configured than nodes available). Red however means that you have lost data and - while this might be temporary - immediate action is required. In this case, the server log will hold more information on what happened. The color can be obtained by issuing a GET request (using cURL, wget, or similar) to http://<crate-url>:4200/ (accessing this URL with a browser on any version newer than 0.57.x will redirect to /admin) and parsing the returned JSON.
{
  "ok" : true,
  "status" : 200,
  "name" : "Albristhorn",
  "cluster_name" : "mycluster",
  "version" : {
    "number" : "0.56.3",
    "build_hash" : "652bcb5d140aea32efe282336e1f558d9c592904",
    "build_timestamp" : "2016-10-25T17:31:44Z",
    "build_snapshot" : false,
    "es_version" : "2.3.4",
    "lucene_version" : "5.5.0"
  }
}
When the number of replicas has been changed or a previously offline node comes back online, CrateDB enters a state of recovery that effectively (re)distributes shards to nodes. While this is a rather non-linear process (different nodes copy some amounts of data to other nodes), CrateDB offers a percentage to better anticipate when the process is finished.
Logging
In case CrateDB encounters a serious error, it will not only return an error to the client but also add a log entry on the server. For that it is important to configure logging correctly, and monitor any events that might be impeding the continued operation. Events that are often encountered include CircuitBreaker exceptions where CrateDB prevents queries from running into memory issues, or messages about other nodes that couldn't be reached. The easiest way is to count appearances via grep, an example log message could be:
[2016-11-10 19:26:22,676][WARN ][indices.breaker          ] [cratedb-1] [FIELDDATA] New used memory 20300063956 [18.9gb] for data of [_uid] would be larger than configured breaker: 20251882291 [18.8gb], breaking
...
What Now?
Monitoring the cluster's CPU, memory, and disk is only the first step, with appropriate responses to this data being key. Of course the actions are highly dependent on what the business case for this particular CrateDB cluster is and what the goals are. However, in general there are a few common responses available and developers and administrators should have an idea of:
- Mistakes: Mistakes happen and sometimes the heap size is not set properly or an existing table setup exhibits unexpected behavior from testing. The first step should always be to find out if something changed (recently) and if everything is set up properly.
- Optimize: This is the most important point. By choosing the number of shards right and having suitable partitions and routing set up, along with any customized configuration and optimized queries will get the most out of a cluster.
- Scale out: CrateDB is horizontally scalable and adding machines can help since the same number of shards will be worked on by a larger number of nodes.
- Ask: We are happy to help ?. We will respond on StackOverflow or if you feel it's a bug open a ticket on GitHub. For production issues, we recommend our Enterprise Support plans available!
To sum up, monitoring a CrateDB cluster can not only improve its performance but also improve code quality and queries - which in turn can end up saving money and time! Furthermore having an eye on the cluster can prevent unexpected outages and provides a glimpse on what is often the heart of a thriving business!
We are always curious about your use cases and how you monitor them, let us know on twitter!