Prometheus is a monitoring and alerting tool that works well for machine data, service-oriented architectures, and microservices. Prometheus provides a powerful query language, and a number of visualisation tools, including Grafana integration.
One of the challenges collecting machine data is that there’s often a lot of it. So keeping it around for the long-term can sometimes be tricky. Fortunately, Prometheus supports external storage solutions.
In this post, we’re going to connect Prometheus to CrateDB. CrateDB is a distributed SQL database that is built for massive amounts of machine data. Using CrateDB allows us to effortlessly scale out Prometheus.
For the purposes of this post, I will assume you’re running Mac OS X. But the instructions should be trivially adaptable for other platforms.
Install CrateDB
First we need to install CrateDB.
We’re going to use CrateDB 2.2.0, because the CrateDB Prometheus adaptor requires that version or higher to work.
We can grab the 2.2.0 release binary directly from the CrateDB release archive:
$ wget https://cdn.crate.io/downloads/releases/crate-2.2.0.tar.gz
$ tar -xvzf crate-2.2.0.tar.gz
$ cd crate-2.2.0
As long as you have Java 8 installed, running CrateDB is as simple as this:
$ bin/crateFor more detailed installation instructions, consult the docs.
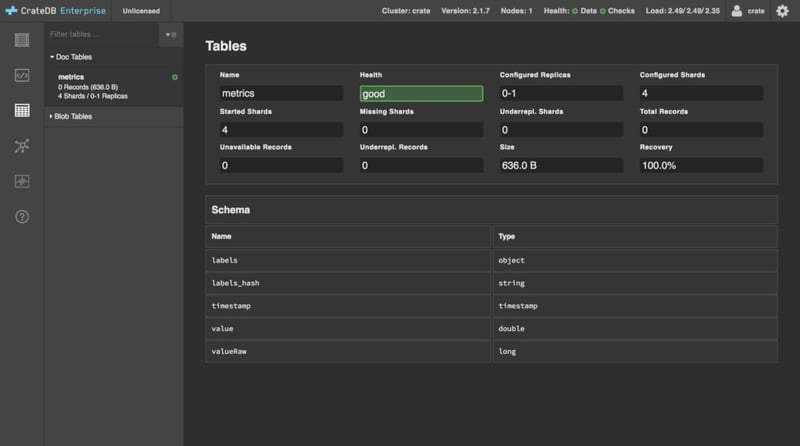
Once CrateDB is running, let’s create a table in CrateDB for Prometheus to write to.
Open up the interactive console by visiting:
http://localhost:4200/#/console
Then execute this query:
CREATE TABLE "metrics" (
  "timestamp" TIMESTAMP,
  "labels_hash" STRING,
  "labels" OBJECT(DYNAMIC),
  "value" DOUBLE,
  "valueRaw" LONG,
  PRIMARY KEY ("timestamp", "labels_hash")
);
You can view your new table here:
http://localhost:4200/#/tables/doc/metrics
Install the Prometheus CrateDB Adaptor
Next, let’s grab the Prometheus CrateDB adaptor.
We have prebuilt binaries available. If you don't see one for your architecture there, or would like to build the adapter manually, you can do so.
Leave CrateDB running in your first terminal, and open a second one.
If you don’t have Go already installed, the easiest way to do this on Mac OS X is with the Homebrew package manager.
You can install Homebrew like so:
$ /usr/bin/ruby -e "$(curl -fsSL https://raw.githubusercontent.com/Homebrew/install/master/install)"And once Homebrew is installed, you can install Go like so:
$ brew install goIf you’re not using Mac OS X, check out the Go downloads page, or install Go from your operating system’s native package manager.
Once you have Go up and running, you can install the CrateDB adaptor like this:
go get github.com/crate/crate_adapter
cd ${GOPATH-$HOME/go}/src/github.com/crate/crate_adapter
go build
Once that’s done, you can start the CrateDB adaptor, like so:
$ ./crate_adapterInstall Prometheus
Finally, let’s install Prometheus.
Leave the CrateDB adaptor running in your second terminal, and open a third one.
Head on over to the Prometheus download page.
Download 1.7.1 like so:
wget https://github.com/prometheus/prometheus/releases/download/v1.7.1/prometheus-1.7.1.darwin-amd64.tar.gz
tar -xvzf prometheus-1.7.1.darwin-amd64.tar.gz
cd prometheus-1.7.1.darwin-amd64
Now, open prometheus.yml, and add the following to the end of the file:
# CrateDB adaptor config
remote_write:
   - url: http://localhost:9268/write
remote_read:
   - url: http://localhost:9268/read
The default Prometheus configuration sets Prometheus up to collect metrics about itself. So with our additional configuration, Prometheus is going to read and writes those metrics to the metrics table we created in CrateDB.
Start Prometheus like this:
./prometheusThen head on over to the CrateDB admin UI:
http://localhost:4200/#/tables/doc/metrics
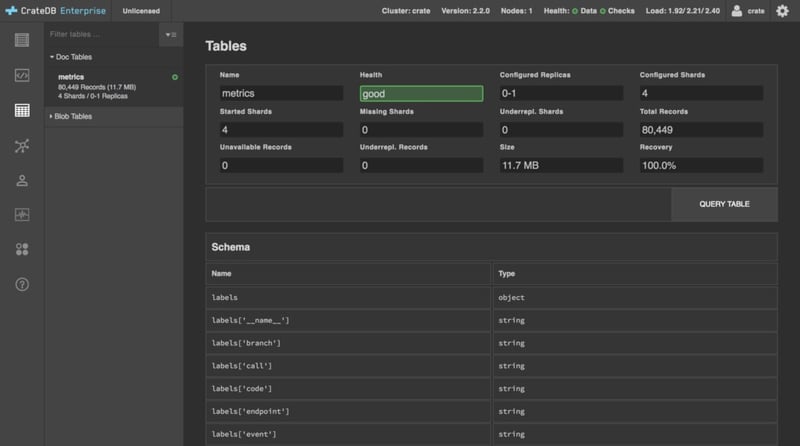
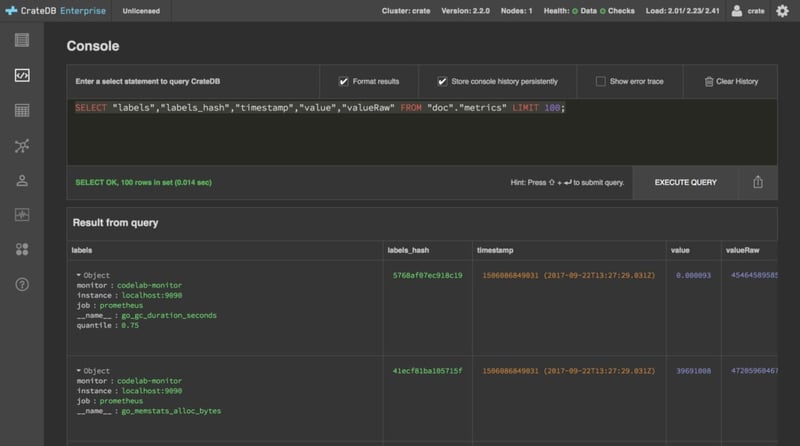
Select QUERY TABLE, and you should see that your metrics table is filling up with data from Prometheus.
From here, you can adapt this setup to your own needs. A good first step would be configuring Prometheus to monitor something besides itself. :)
If you’d like to monitor the CrateDB adaptor, it provides its own metrics here:
Wrap Up
In this post we set up CrateDB and Prometheus and use the Prometheus CrateDB Adaptor to connect the two.
Prometheus is a fantastic monitoring system, but scaling can be an issue with a lot of data and long retention times. Fortunately, you never have to throw away old data with CrateDB as your storage backend.
CrateDB can ingest millions of data points per second, and allows you to effortlessly scale up your data storage to any size you can imagine.
While CrateDB handles your data storage, you can reliably run Prometheus on a single machine. And when your users want to access older data, it is transparently requested from your CrateDB cluster.
What’s more, if you want to do heavy statistical analysis, you can process the data directly in CrateDB, taking advantage of CrateDB’s lighting fast distributed query engine.