Zoomdata helps you query and visualize your big data sets to gain valuable insights quickly and easily. The (beta) Crate connector supports all Crate data types, including objects.
Add Data Source
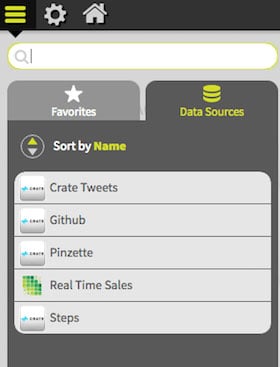
Click the hamburger menu item on the left hand side of the Zoomdata dashboard, then click Data Sources and Edit Data Sources and select the Crate data source.
Give the connection a relevant name and click Next. Select the Input New Credentials radio button and add the JDBC url for nodes in your Crate instance, for example:
crate://NODE_ADDRESS1:4300,NODE_ADDRESS2:4300,etc
You can add as many nodes in the cluster as you want, a greater number helps with redundancy and fallbacks if one node becomes unavailable. With every query, a node is chosen via round-robin. Validate the connection, and click Next.
After selecting the schema and individual fields for the data source you can override field names, types, and other details depending on the underlying schema and select the refresh interval. Finally you can enable or disable the chart types you want available for this data source, and settings for each chart type.
Click Finish and you jump straight into the chart building screen.
To recap, this video contains a step-by-step guide to setup Crate with Zoomdata.
Below is an example of a pie chart that shows the breakdown of git events taken from the GitHub archive and imported into Crate.
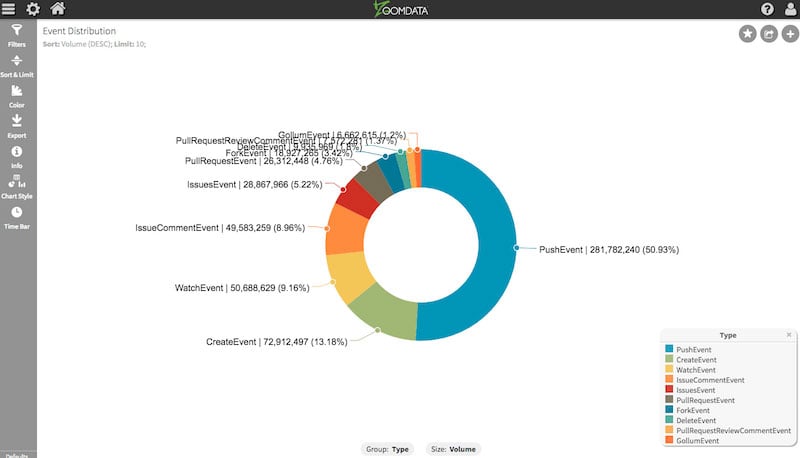
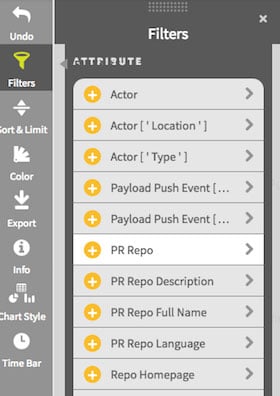
On the left hand side you can see the options for filtering, sorting, limiting, styling and exporting your data and visualizing it. Each option provides a lot of configuration and customization to experiment with.
For example, you can change filters and results update in real time.
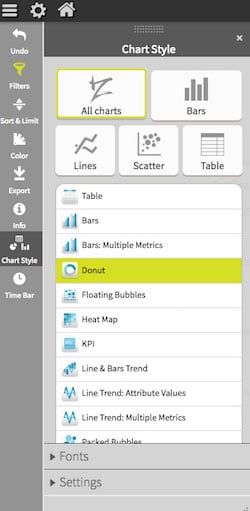
Or to change the chart type.
Once you have the analysis and visualizations important to your business created, you can save them for easy access. Any favorites you add will be accessible on your personal dashboard, but you can also share them amongst your team or particular users.
Live Mode
You may have noticed a live mode option in the charts tab of the data source configuration. If you have a time-based attribute in your data set, this allows for 'live', periodic updating of data sources and the ability to 'scrub' back and forth through the data.
Analyze This
The combination of Crate's super fast data query engine and the easy to use visualization tools of Zoomdata make a powerful set of tools for discovering the important things you and your business need to know.