In the first blog post of this series, we introduced you to a proof-of-concept Crate.io has been working on to help Illwerke VKW improve the operation of the Kopswerk I hydroelectric power plant.
In this follow-up post, we will go into some technical details of the VKW proof-of-concept and explain how our partner craftworks used machine learning to detect and predict critical events.
Then, we will show you how you can use Python to construct a similar machine learning model that can be used to predict events.
Detecting events
As previously mentioned, turbines experience the most physical stress when powering up and powering down.
When powering up or down, a pressure surge (also called water hammer) caused by the closing of the turbine valve results in a pressure oscillation in the surge tank.
Normally, these oscillations are harmless. However, they can sometimes result in instantaneous or delayed shutdowns—both of which damage the turbine. These anomalous oscillations are known as critical oscillations.
Because critical oscillations drastically reduce the lifespan of the turbines, we implemented a system that uses sensor data to detect these events.
Let's take a look at the sensor data.
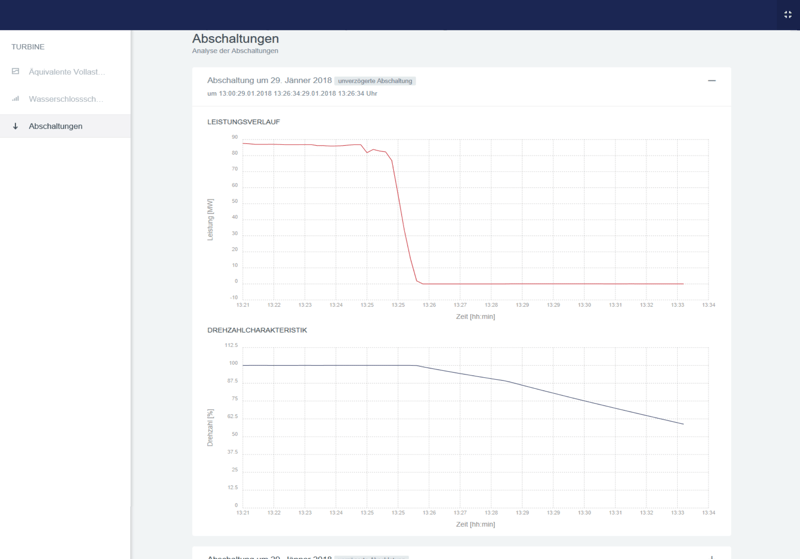
This screen shows the power (top) and the rotational frequency (bottom) occurring during an instantaneous shutdown:
And here's what the pressure oscillation in the surge tank might look like:

To develop the algorithms for detecting critical events, we used VKW domain knowledge and signal processing methods to extract features that are characteristic of critical oscillation events. Using these features, we were able to train a machine learning model to detect the events with high accuracy.
For shutdown events, the main characteristic is that the rotational frequency sensors report values close to zero.
During regular operation, the rotational frequency sensors report values way above zero. These values are expressed as a percentage of the target rotational frequency needed to produce a standard alternating current (AC) suitable for the European power grid.
The classification algorithm executes the following steps:
- Watch for rotational frequency sensor values close to zero
- If they occur, analyzes the rotational frequency values in the minutes before
- Using on the maximum rotational frequencies that occurred before, classify the type of shutdown
With this in place, we can use more sophisticated techniques to predict events in advance.
Predicting events
Now that we have a solution for detecting critical events, we can use this information for developing more sophisticated machine learning solutions, in which the events serve as labels for the sensor data. This is a task for supervised machine learning.
Supervised learning is used to find a function that approximates the relationship between input and output (e.g., sensor data and events). (In case you're curious, check out this blog post by Devin Soni that goes into the differences between supervised and unsupervised learning.)
Determining a relationship between sensor data and events will help us predict events in advance—by hours, or even days. These sorts of predictions can be used to enable proactive (instead of reactive) decision making, thereby reducing downtime and the associated costs.
To achieve this, we can first train a recurrent neural network model (RNN) with historical data. The Crate IoT Data Platform then allows us to integrate this trained model into a stream processing pipeline that predicts events in realtime.
Indeed, real-time insights demonstrate one of the core advantages of stream processing over traditional batch processing methods.
A practical example
But enough of the theory.
Let me show you how to construct, train, and use a simple machine learning model that can predict events.
To do this, we can use Keras, a high-level Python library for working with different machine learning frameworks.
Here's a definition of the problem:
Using a sequence of sensor readings taken during a fixed period, we want to classify events predicted to occur in the next 48 hours.
Due to the high volume and throughput of the sensor information, raw data is not kept around permanently. So, we must purposefully sample the data and set it aside for analysis.
To do this, we can create two new tables:
- A table to hold sequences of sensor readings taken during the time span leading up to each detected event.
- A table to hold sequences of sensor readings taken during random uneventful time spans.
To analyze this data, we can use a long short-term memory (LSTM) model. LSTMs are a specialized type of RNN, invented by Sepp Hochreiter, head of the Institute of Machine Learning at Johannes Kepler University of Linz in Austria. They can analyze data sequences much faster and with better success than other RNN algorithms.
LSTMs are well-suited for:
- Translating a sequence of words in one language into a sequence of words in another language
- Speech recognition
- Anomaly detection in time-series data
(And much more...)
We can set up our model, like so:
Let's break that down:
- First, we import the needed Python classes from Keras.
- Then, we create an empty sequential model.
- Using the sequential model, we layer three LSTM cells separated by dropouts (to reduce overfitting).Stacking multiple LSTM network adds additional levels of abstraction, which helps to solve the problem in a more general way. Additionally, this a more effective way to improve training speed than, say, increasing the number of memory units—in our case, 12.
- Since we are dealing with a classification task, we add a dense layer with one unit and the sigmoid activation function. Basically, this outputs a probability value between 0 and 1 for each new input batch.
- Finally, the model is compiled with binary cross-entropy loss and Adam optimization.
With our model in hand, we can start training.
However, since the training data would be too big to fit into a standard computer's memory, we must retrieve batches of data from CrateDB and use this to generate batches of data suitable for our RNN.
Here's a function that does that:
Here's how that works:
- We select a random subset of events (of size
db_batch_size) and query the corresponding event data from the database. - We then split that event data into batches (of size
rnn_batch_size) and structure it for learning. Specifically, we associate prior sensor readings (X) with detected eventsyusing thewindow_datafunction (shown below). - Finally, we return a generator that yields the results and iteratively repeats this process.
Here's the window_data function:
Here's what that does:
- We iterate over values of
X(prior sensor readings) in steps of sizestepsize. - For each step:
- We create a chunk of
Xand append it toX_out. - We create a chunk of
y(detected events) and append it toy_out.
- We create a chunk of
- Finally, we return two arrays with the element at position
iofy_outbeing the target for the element at positioniofX_out.
Here's what that looks like:
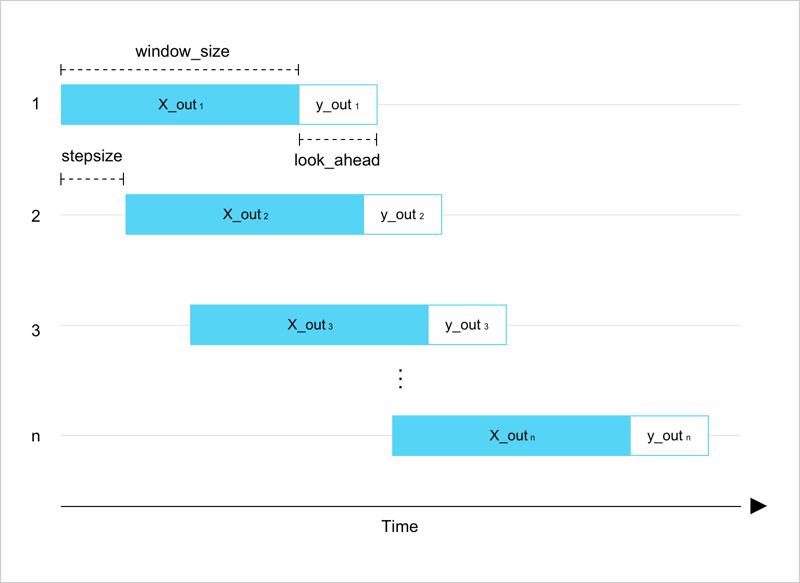
Each iteration of the while loop is shown on the vertical axis. The horizontal axis represents the time axis.
The chunk of data y (detected events) always occurs after the chunk of data X (prior sensor readings).
Finally, we can use the data returned by this function to train our model:
Here, we're using the fit_generator function to train a model batch by batch with the data_gen generator.
Once the model is trained, you can use it to predict events, like so:
Here, X_new is an array of sensor readings. This array must be structured like the arrays returned by the data_generator function.
The y_new variable will contain probability values between 0 and 1 for each event class we trained the model on. In our case, we're using binary classification (i.e., event or no event), so y_new will contain two values.
The next step would be to evaluate the predictions.
From here, you can optimize the model architecture and configuration. For example, you could change:
- The number of LSTM cells
- The dropout-rate between layers
- The input data batch size
- And so on
Optimizing any neural network can be difficult because there is no single correct way to do it, and the best choices will always depend on your specific problem. For an introduction, check out this post on tuning LSTMs with Keras.
Wrap Up
In this post, we told you about how Illwerke VKW is using CrateDB and time-series data to improve the functioning of the Kopswerk I hydroelectric power plant. We then illustrated this with an example of how to train an LSTM-powered machine learning model on historical data so that it can be used to predict events.
Models like this can be integrated with the Crate IoT Data Platform and used to perform real-time prediction.
The Crate IoT Data Platform makes it easy to build smart systems that collect streams of data from connected devices and sensors, enrich the data, analyze it, and subsequently take action "in the moment."
(This post was a cooperation between Crate.io and Craftworks and was authored by Daniel Ressi and Patrick Fürst.)