Demonstrating the power of a database is hard.
It's difficult to visually communicate a database's features and benefits in a way that captures someone's attention. Which is a problem, because we had to find something that would make our booth and product stand out at conferences.
By creating a demo that was fun and easy to grasp, we were able to demonstrate the value of CrateDB and generate interest during our time at OSCON and IoT World.
Here's what we did.
Hardware Setup
Having seen various sensor deployments across different industries, we reduced them to the core of what they were: sensors putting data into storage to retrieve, visualize, or process further.
With this in mind we came up with the idea to track faces at our booth.
For our processing cluster, we went with four custom Intel NUC devices with an 4-core x86 processor, 8 GiB of RAM, and an SSD. With CrateDB, this can easily handle the load of a several tens of thousands inserts a second.
For our sensors, we needed something that was powerful, portable, interesting to look at, and had camera support.
Oh, and nerdy. 🙂
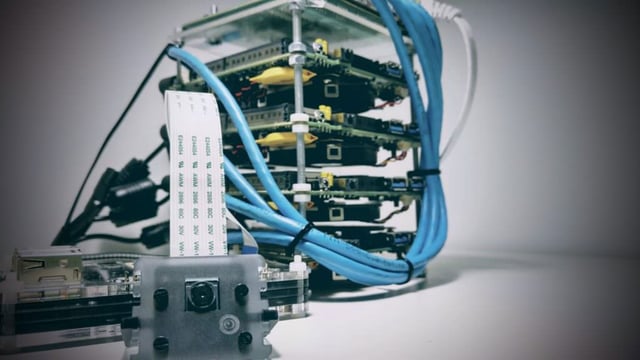
So, we went with a Raspberry Pi v3, with its built-in WiFi, quad-core ARM processor and attachable camera (the NoIR version).
Here's the combined setup:
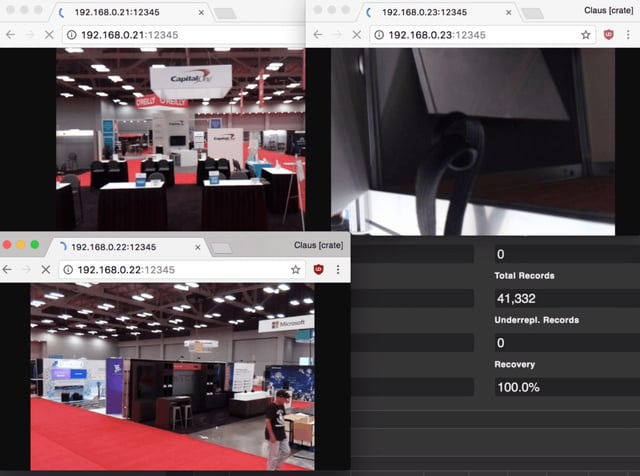
And here's what our booth looked like with the two cameras installed left and right:
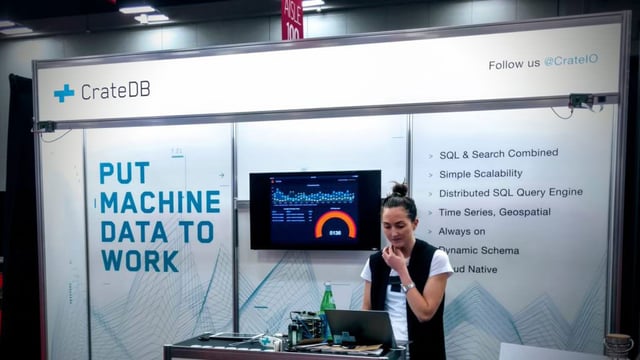
You can see the cluster of NUCs on the stand next to the laptop.
Image Recognition to Go
OpenCV is an open library that comes with pre-trained models for recognizing areas that have frontal facial features in an image. This library did all the heavy lifting for tracking faces via Haar cascades.
Tutorials for their Python interface can be found all over the internet, but what it boils down to is this:
  for pic in cam.capture_picture():
    faces = classifier.classify(pic)
    for face in faces:
      # create bulk insert for the db
      # draw a frame on the picture
      # etc.
The code itself is pretty simple. The complexity arises in managing the dependencies OpenCV and the application comes with.
Because of this, we used Hypriot OS which works with Docker on ARM right out of the box. This allowed us to create a container that provides all the necessary dependencies along with Python code to send data to a HTTP endpoint.
The end result was a portable, reproducible solution that works on any Raspberry Pi.
The Microservice Architecture
With our container built for ARM, we hooked up the camera and automated the WiFi network connection (fairly straight forward) so that we could SSH into each Raspberry Pi.
The NUC cluster had its own Docker Swarm (because as of May 2017, devices cannot be mapped with Docker Services) and a HTTP endpoint to the outside world (called Eden-Server).
We set up VIP load-balancing to take care of distributing requests across the NUCs, and ran a local CrateDB instance on each cluster (called global mode) with DNSRR endpoint mode.
With CrateDB's ability to keep data consistent, we ended up with a distributed four-node database cluster via four load-balanced endpoints.
Consequently, a single IP to send requests to is enough for all Raspberry Pis.
Polishing It Up
With the system architecture done, we had to address the following issues::
- What does the camera see? Is it in focus?
- What's the actual frame rate?
- What does the classifier detect? Are the parameters okay?
- What other data do we want to save?
A Simple MJPEG Server
OpenCV expects some screen to be attached to the device, which is not the case on a headless Pi. So we needed to get the images out somehow.
The simplest solution, since the application is already looking at each image individually, is to just place a file on disk and keep overwriting it in every iteration.
If you start a Python web server, you can watch the camera by reloading the image manually for each new frame.
Since this is not at all practical and somewhat inefficient, we decided to go with the more common variation of that pattern, MJPEG, and build it into the application itself.
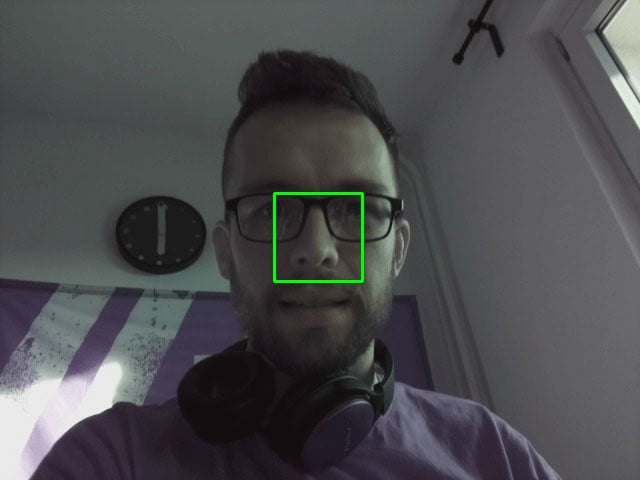
This gave us a low-cost and easy way to calibrate the viewport, see what the camera sees, and adjust the focus properly!
Here's what that looked like:
Profiling
Classification in Python is quite heavy on the CPU, so we expected the frame rate to be somewhat lower than reading directly from the camera.
With the Raspberry Pi camera attached directly to the GPU of the Pi, this made simple recordings quite fast: around 60 frames per second with a 1080 pixel resolution.
However, upon starting the container, it seemed we couldn't get it quite as high. So we optimized the code a bit further and the frame rate went up a bit.
Data, Data, Data
Each iteration produced a few data points:
- The number of faces
- Their relative locations in the image, and
- The image dimensions
All of which were sent to the endpoint, together with the agent (i.e. which Pi it was), the sensor name (Pi camera) and the role (face tracker). This metadata exits to maximize our ability to analyze the rows in the future.
Showing It Off
We chose Grafana as our visualization tool.
With a simple dashboard we could show the detected number of faces around the booth, aggregated by camera per minute, resulting in nice graphs that displayed on a monitor!
Results
Our demo was loved by the booth's visitors. :)
Lot of people were curious about how and what the software does. With the NUC cluster handy, we were able to explain a distributed system very well. And people were even able to touch it!
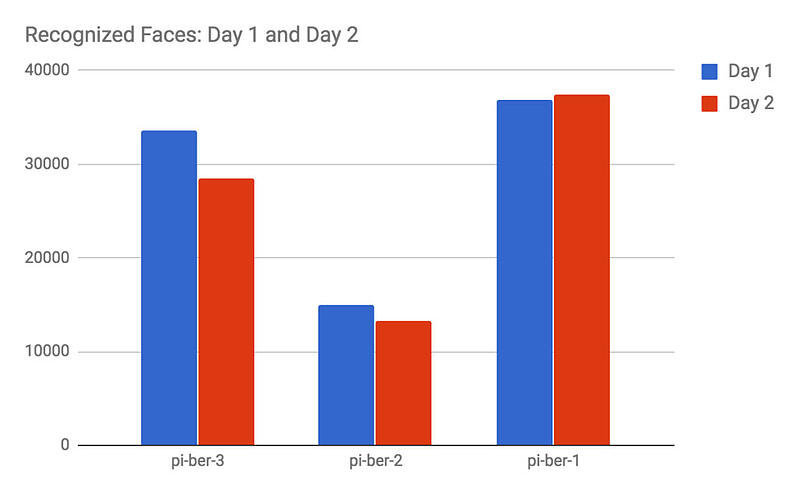
Looking at the data, the Raspberry Pis found 166.066 faces in total, during the two days at the expo. Most faces were recognized at around 4pm, with a slow start at around 9am, and the pace really picking up at the lunch break:
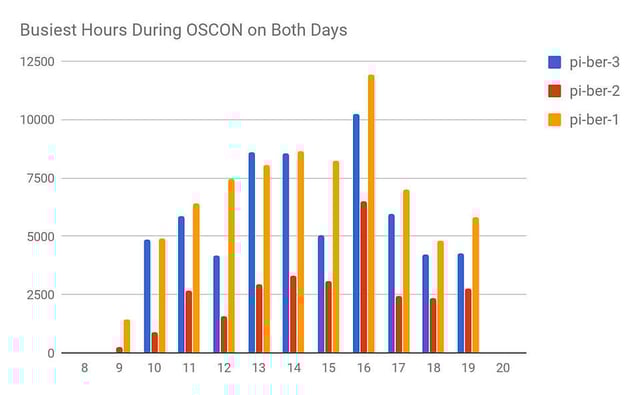
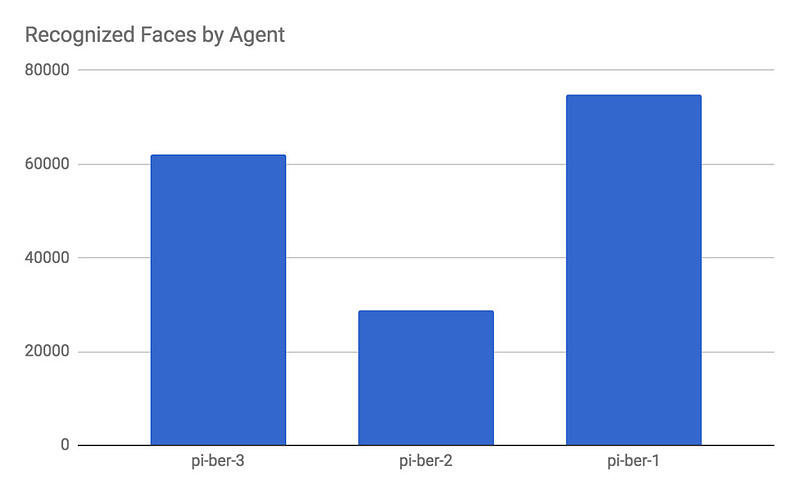
The agents (Pis) were strategically placed, with pi-ber-3 and pi-ber-1 overlooking the booth and lanes, and pi-ber-2 placed on the desk in the middle (which had a much lower and narrower view):
While we had the impression that it wasn't as busy on the second day of the expo, the data does not support that: