CC by-SA 2.0, Kristin Ausk
Database performance depends on many factors. There are many parameters user can tweak, but the outcome in complex setups is not always obvious. While we had a big cluster of crate instances available, we faced the challenge to load huge amounts of data into it to initialize the distributed database. A series of experiments resulted in an awesome 4.8 mio records/rate of ingesting data into our cluster! To get there, we explored the effect of network connections, number of nodes, and shard configuration.
Setup
We used the Azure platform, kindly provided by Microsoft for the evaluation to build a set of strong G-series VMs to generate test data that was sent to our cluster of crate instances. The database cluster consisted of three master nodes for the purpose of monitoring and propagating cluster changes. In our setup they effectively had only work to do during the setup of the cluster since after that they mostly idled during the experiment. A small cluster of Ganglia nodes took care of the performance monitoring.
We chose D12v2 nodes as VM types for the data nodes (as well as the master nodes). They come with four cores, 28 GB RAM, and 200 GB local SSD storage. We assigned half of total RAM to the Crate heap and left the other half of the memory for Lucene to leverage the underlying OS for caching in-memory data structures. The following memory split guarantees the optimal Crate performance. Local attached storage is crucial for good crate performance. Our SSD had been specified with 12,000 iops.
The even bigger G3 VMs created a simple table on the cluster like this:
CREATE TABLE loadtest (
    data string
) CLUSTERED INTO x SHARDS WITH (num_of_replicas=0, refresh_interval=0);
As the number of shards (x) needs to be defined at table creation time, we ran a number of tests with different configurations. We've got good results with twice the number of shards as the number of data nodes, as a rule of thumb: A higher number of shards enables the cluster to better distribute the data to the nodes and thus balance the load over the cluster. With too many shards, the overhead eats up that advantage, though. We discuss this factor in more detail later on in this article.
We tweaked a few extra options when we created the table: To just measure ingest performance, we turned off replication as well as the refresh mechanism during the test. In production environments you should certainly turn that on again after ingestion.
Pump it up!
The python powered load generation machines produced a long series of bulk insert request like this:
INSERT INTO loadtest (data)
VALUES('1st random data string of n bytes',
       '2nd random data string of n bytes',
       '...',
       'mth random data string of n bytes');
Our reference setup was inserting 1000 times 512 bytes in one batch, resulting in 2.5 MB per bulk insert. There is a huge difference in inserting one thousand times a single record compared to inserting all of them in a single request: apart from the overhead imposed by connection handling, when doing bulk operations the plan for the statement needs to be generated only once and can then be executed with different values.
Merge larger segments
Whenever time permits, Crate merges data structures called segments to improve read performance. To ensure that requests are processed with reasonable response times, the amount of I/O bandwidth dedicated to this background process is limited. But as we had lots of bandwidth available and we decided that there was no need to process other queries while we loaded our cluster, we set store.throttle.max_bytes_per_sec to 700mb during the import.
With memory.index_buffer_size: 25% Crate allocates the certain percentage of the total heap for the indexing buffer. The store module controls how index data is stored and accessed on disk. The mmapfs option for index.store.type configures the Lucene index to make use of the buffer cache of the operating system when writing indices. And finally bootstrap.mlockall: true makes the JVM lock its memory and thus prevent it from being swapped by the operating system.
It is a real challenge to actually feed the Crate database cluster with enough data. Our threaded python generator opened 1,024 sessions to the endpoint in parallel (spawning 32 processes each with 32 threads) and repeated that procedure 50 times. Especially creating the bulk request takes some time in the Python script.
To measure the performance of the cluster and not the client libraries, we delivered the SQL statement directly to the HTTP endpoint of the data nodes. The load generators connected to the data nodes of the cluster in a round robin fashion.
That way we transmitted roughly 24 GB net data to our cluster consisting of initially 14 data nodes, resulting in 51,2 million records in the Crate cluster. Doing so takes about half a minute and eventually results in 1,60 million records per second. This was our reference value to beat
Increasing the number of data nodes
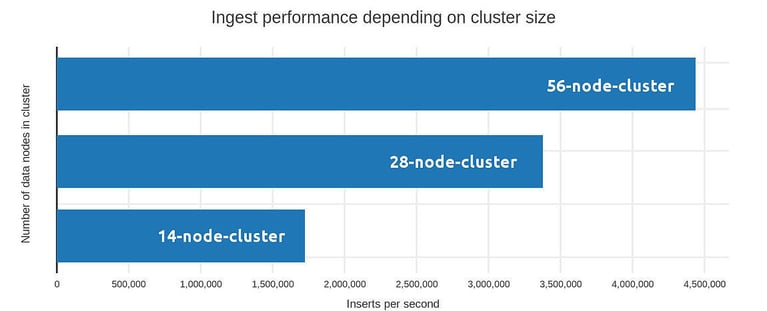
One obvious approach is to add more data nodes to the cluster. The reference setup had 14 modes with 12,000 iops each. We configured 28 shards, resulting in 1.85 million records per second. Could we improve if we doubled that? Indeed, as the same setup with 28 data nodes and 56 shards accelerates the ingestion rate to 3.01 million records per second (see figure 1). Performance definitely benefits from horizontal scaling the data nodes. The gain is slightly sub-linear since there is some overhead in sending the data to its final shards. We are pretty sure that we still could tweak here a little more to squeeze out a few extra 100,000 records per second if we spent more time to find the best fine-tuning of the bulk size at the load generator, but we chose to focus in the cluster this time.

In search of key factors
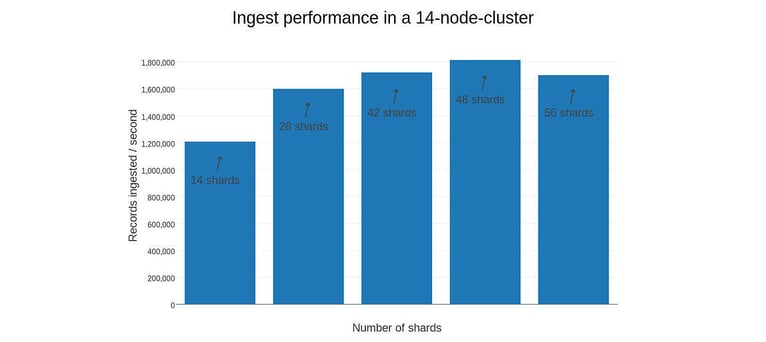
While it's easy to understand that more workers finish a given job more swiftly, we wondered how adjusting the way they work affects their performance. A crucial question is to decide the number of shards in a table. Since their number needs to be defined at creation time of a table, we examined the effect of different setups in a large cluster. Roughly we got best results having at least two shards per node (see figure 2).

DBAs should act with caution, though. Finding the sweet spot depends both on the actual data schema as well on the hardware parameters. As a rule of thumb, you should try to keep all your drives spinning (even if there's nothing more to move in a SSD nowadays), to get the best out of your I/O bandwidth. Reading is adding another aspect: Especially with aggregations your cluster nodes get some work to do and you should try to keep your cores under fire in those situations. The nodes in our test case had four cores each, so read performance might benefit from some additional shards, but here we've been optimizing for write throughput and thus had best results with 48 shards.
Conclusion
Ingestion rates depend on many factors, the number of data nodes having the most important impact. A good choice of shards also affects the performance in a noteworthy way. Finally, the hardware specs of the nodes themselves obviously also affect your results: Look out for lots of iops and a balanced amount of CPU and memory. All that taken into account we've been able to ingest up to 4,800,750.12 records/sec on a cluster of 56 D14v2 nodes with 16 cores each.
Cool.